Fig. D.1
Download original image
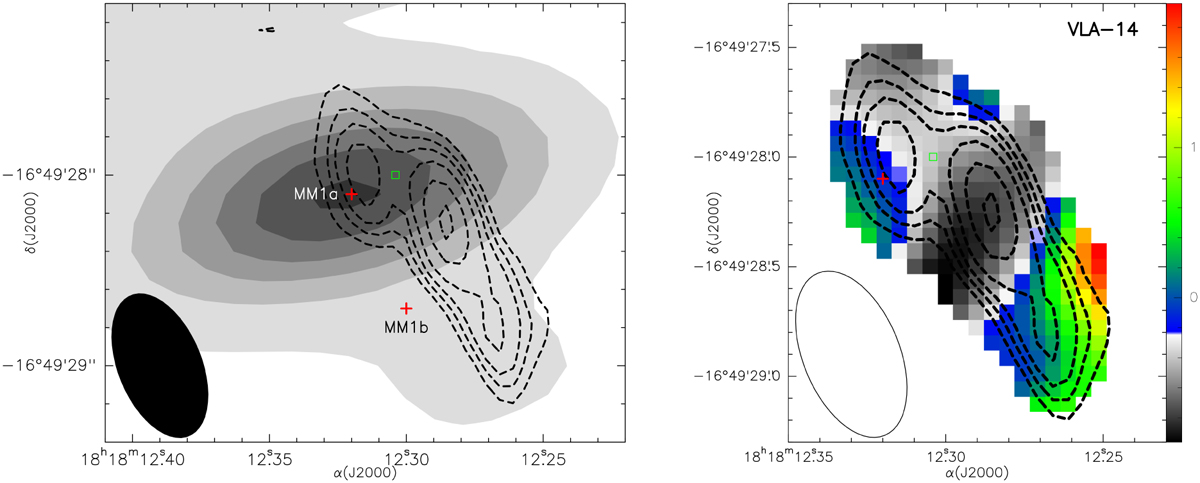
VLA 3.6 cm emission (contours) toward VLA-14. Left: SMA image (gray scale) at 1.3 mm (Busquet et al. 2016) of MM1 located in G14.2-hub-N. Right: Spectral index map (color scale). In both images contour levels are -5, -3, 3, 5, 7, 10, 15 and 20 times the RMS of the map (1.5 µJy beam−1). Red crosses show the peak position of the millimeter detections in (Busquet et al. 2016). Green square shows the position of the H2O maser (Wang et al. 2006). The synthesized beam of the X-band is shown in the bottom-left corner of each image.
Current usage metrics show cumulative count of Article Views (full-text article views including HTML views, PDF and ePub downloads, according to the available data) and Abstracts Views on Vision4Press platform.
Data correspond to usage on the plateform after 2015. The current usage metrics is available 48-96 hours after online publication and is updated daily on week days.
Initial download of the metrics may take a while.