Fig. 14
Download original image
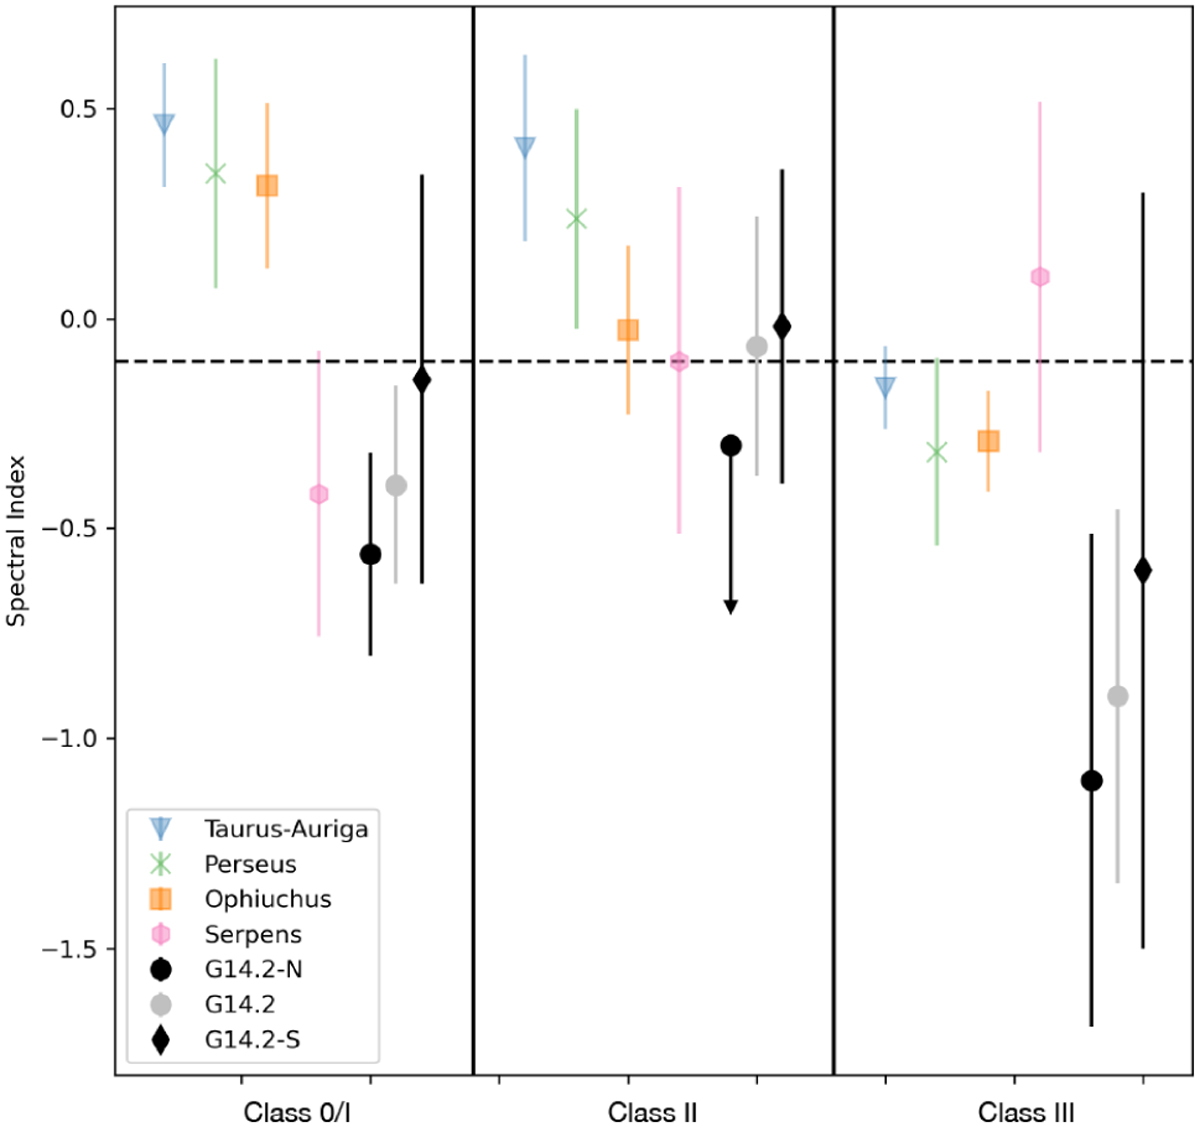
Mean spectral index as a function of the YSO evolutionary stages in different star-forming regions (blue triangles: Taurus-Auriga (Dzib et al. 2015); green cross: Perseus (Pech et al. 2016); orange square: Ophiuchus (Dzib et al. 2013); pink dot: Serpens (Ortiz-León et al. 2015); gray dot: IRDCG14.2, separated in G14.2-N (black dot) and G14.2-S (black diamond)). We note that black and gray symbols are SED-based Stage classifications (Povich et al. 2016) and the groups could be different if a different classification scheme was employed. The black dashed line at α = −0.1 draws the boundary between thermal emission and nonthermal emission.
Current usage metrics show cumulative count of Article Views (full-text article views including HTML views, PDF and ePub downloads, according to the available data) and Abstracts Views on Vision4Press platform.
Data correspond to usage on the plateform after 2015. The current usage metrics is available 48-96 hours after online publication and is updated daily on week days.
Initial download of the metrics may take a while.