Fig. 13
Download original image
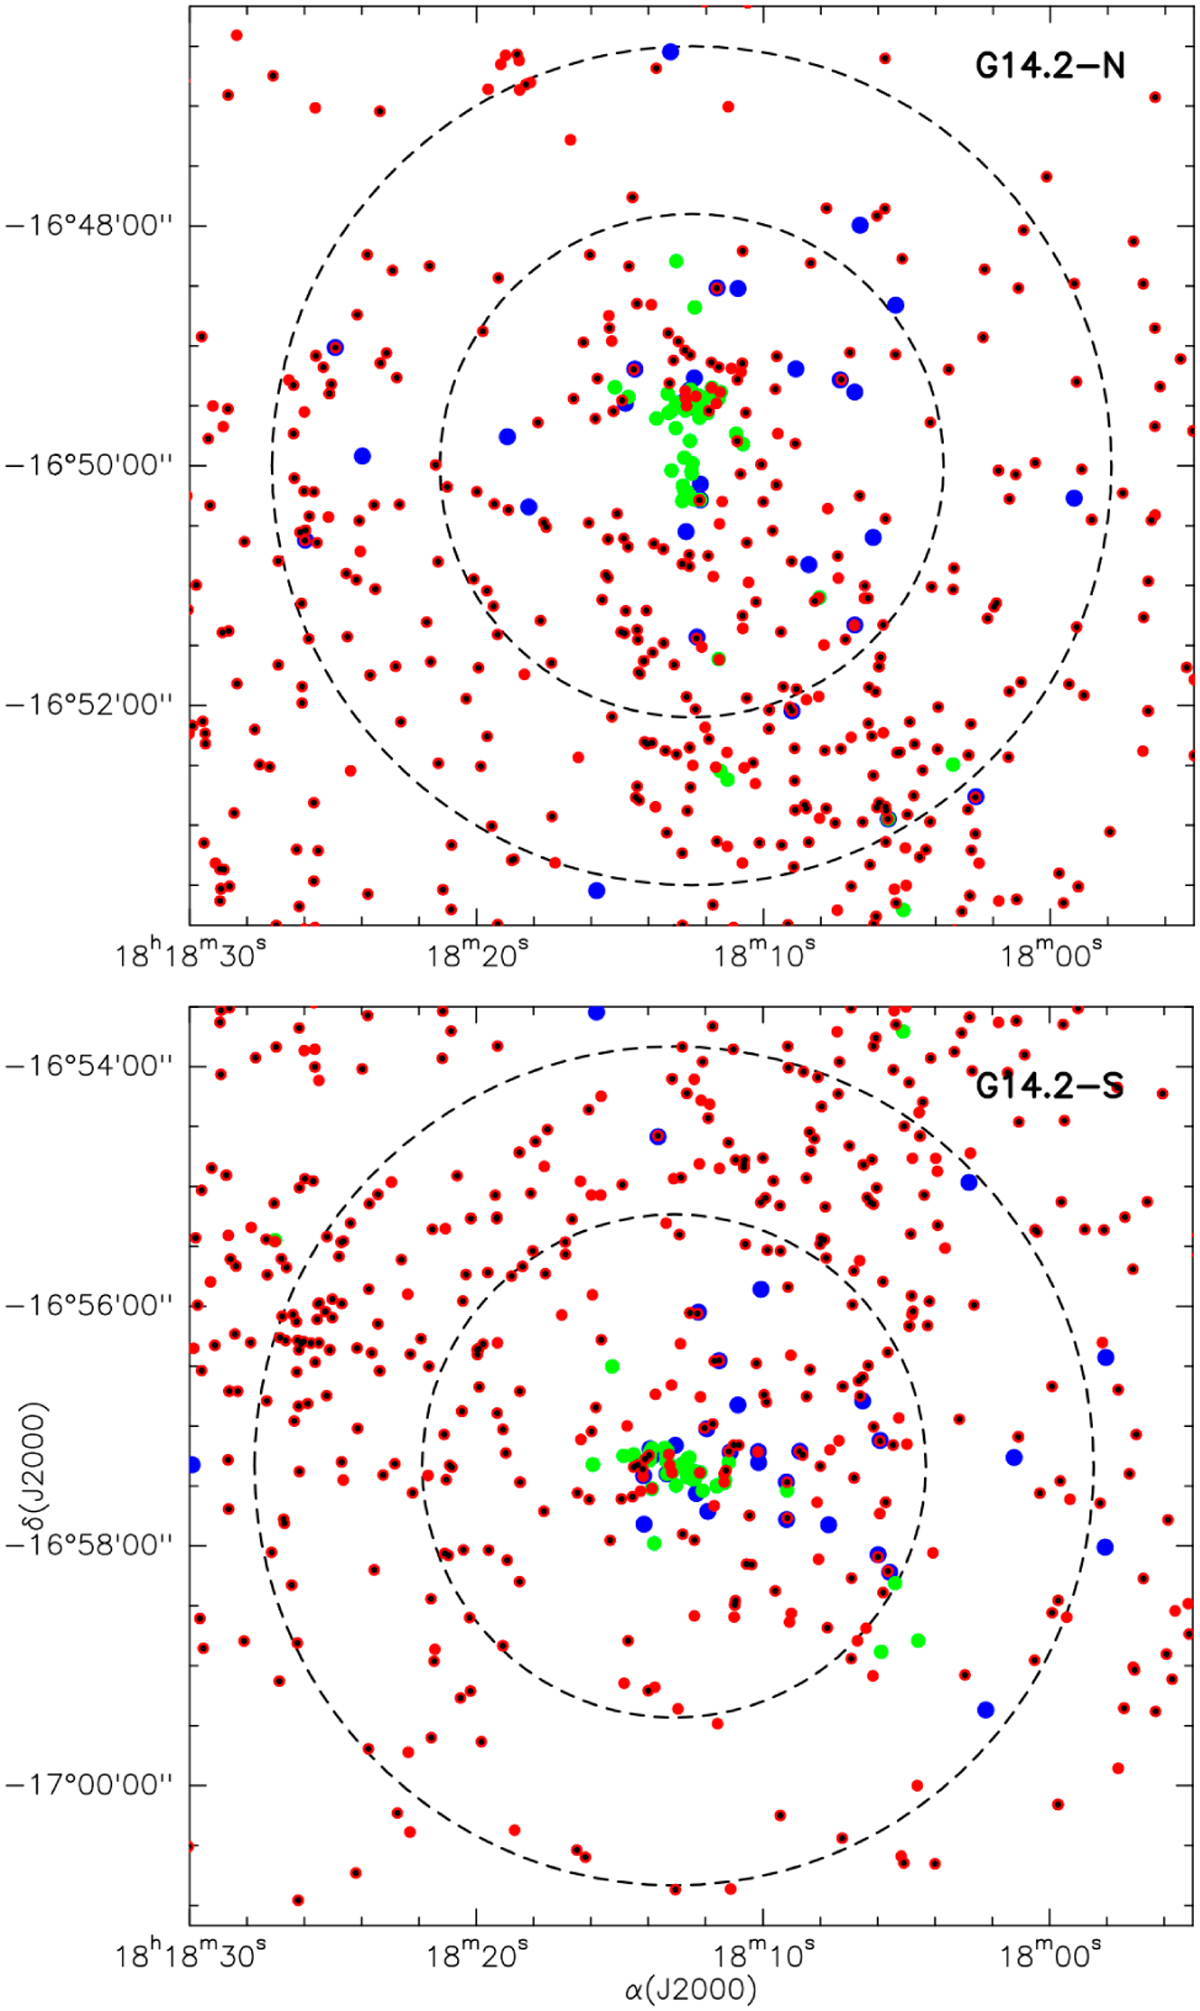
Spatial distribution of the stellar population in G14.2. Top panel shows the northern region of G14.2, while bottom panel shows the southern region of G14.2 (G14.2-N and G14.2-S, respectively). Blue symbols indicate centimeter sources (this work). Green symbols indicate millimeter sources (Ohashi et al. 2016; Busquet et al. 2016; Zhang et al., priv. comm.). Red symbols indicate IR sources (Povich et al. 2016). Black symbols indicate X-ray sources (Povich et al. 2016). The symbol sizes do not correspond to the respective angular resolution. The outer and inner dashed circles represent the field of view at 6 cm (~7′ at 6 GHz) and 3.6 cm (~4.2′ at 10 GHz), respectively.
Current usage metrics show cumulative count of Article Views (full-text article views including HTML views, PDF and ePub downloads, according to the available data) and Abstracts Views on Vision4Press platform.
Data correspond to usage on the plateform after 2015. The current usage metrics is available 48-96 hours after online publication and is updated daily on week days.
Initial download of the metrics may take a while.