Fig. 11
Download original image
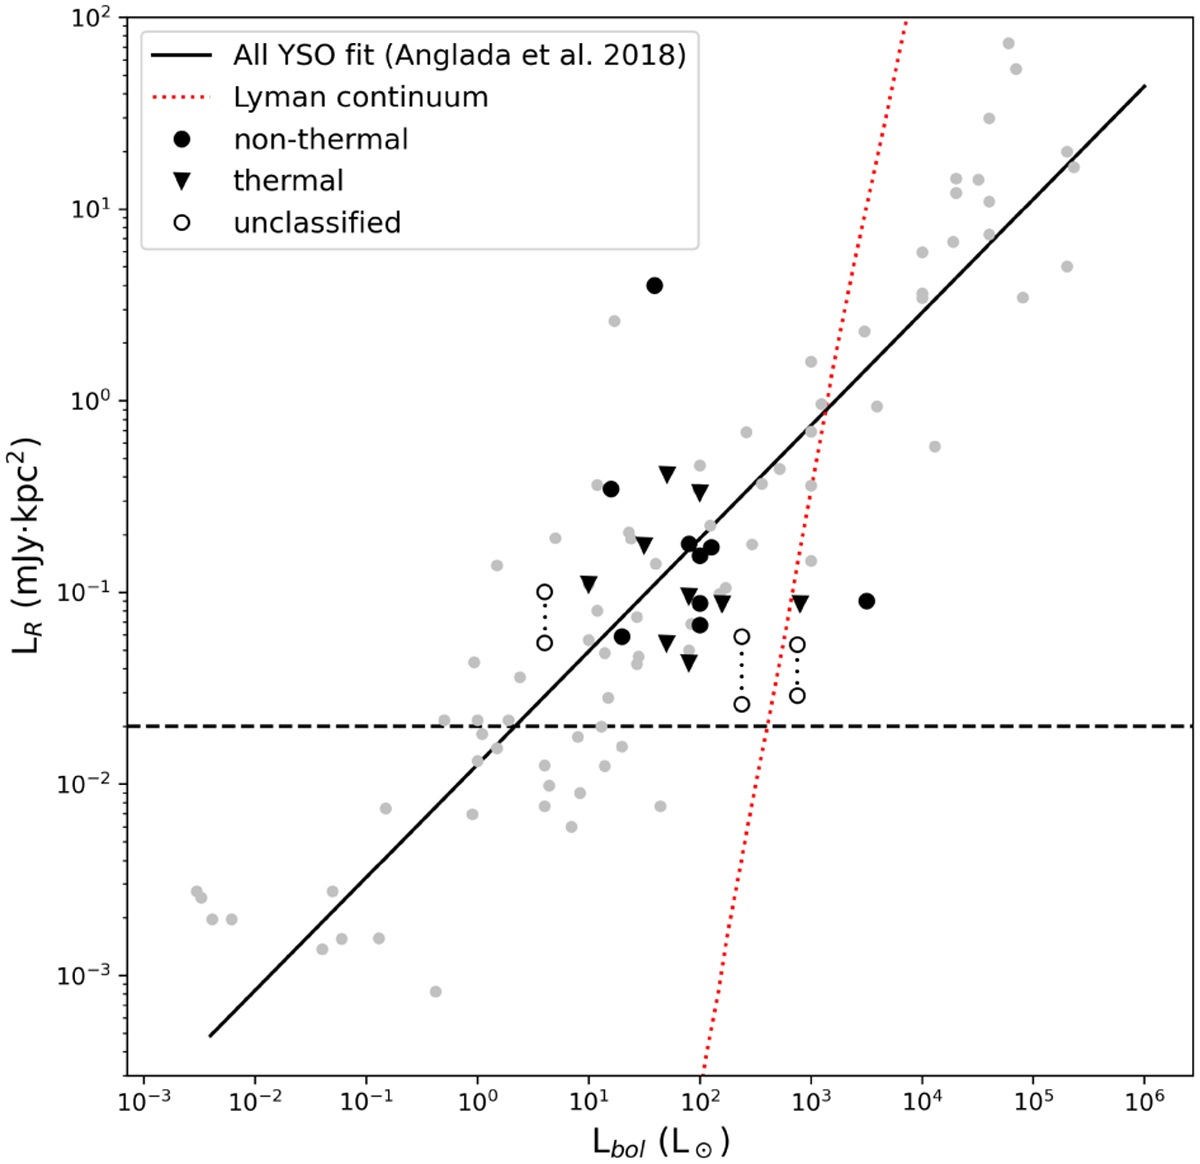
Radio luminosity as a function of bolometric luminosity for the sources with an IR counterpart and a measured bolometric luminosity (Povich & Whitney 2010; Povich et al. 2016). Triangles represent thermal sources, filled dots depict nonthermal sources, and open circles represent radio sources with an unclassified origin of the radio continuum emission in G14.2. For unclassified radio sources not detected at 3.6 cm we extrapolated the 6 cm flux density to 3.6 cm adopting two values of the spectral index, α = −0.7 and α = +0.5 (see main text). Gray dots show the thermal radio jets compiled by Anglada et al. (2018). The solid black line corresponds to the fit done to all radio jets in Anglada et al. (2018). The red dotted line depicts the radio luminosity at 3.6 cm associated with the Lyman continuum flux of H II regions powered by stars of different luminosities (see Fig. 4 from Sánchez-Monge et al. 2013a). The black dashed line depicts our 5σ sensitivity limit in radio luminosity (~0.02 mJy kpc2).
Current usage metrics show cumulative count of Article Views (full-text article views including HTML views, PDF and ePub downloads, according to the available data) and Abstracts Views on Vision4Press platform.
Data correspond to usage on the plateform after 2015. The current usage metrics is available 48-96 hours after online publication and is updated daily on week days.
Initial download of the metrics may take a while.