Fig. 1
Download original image
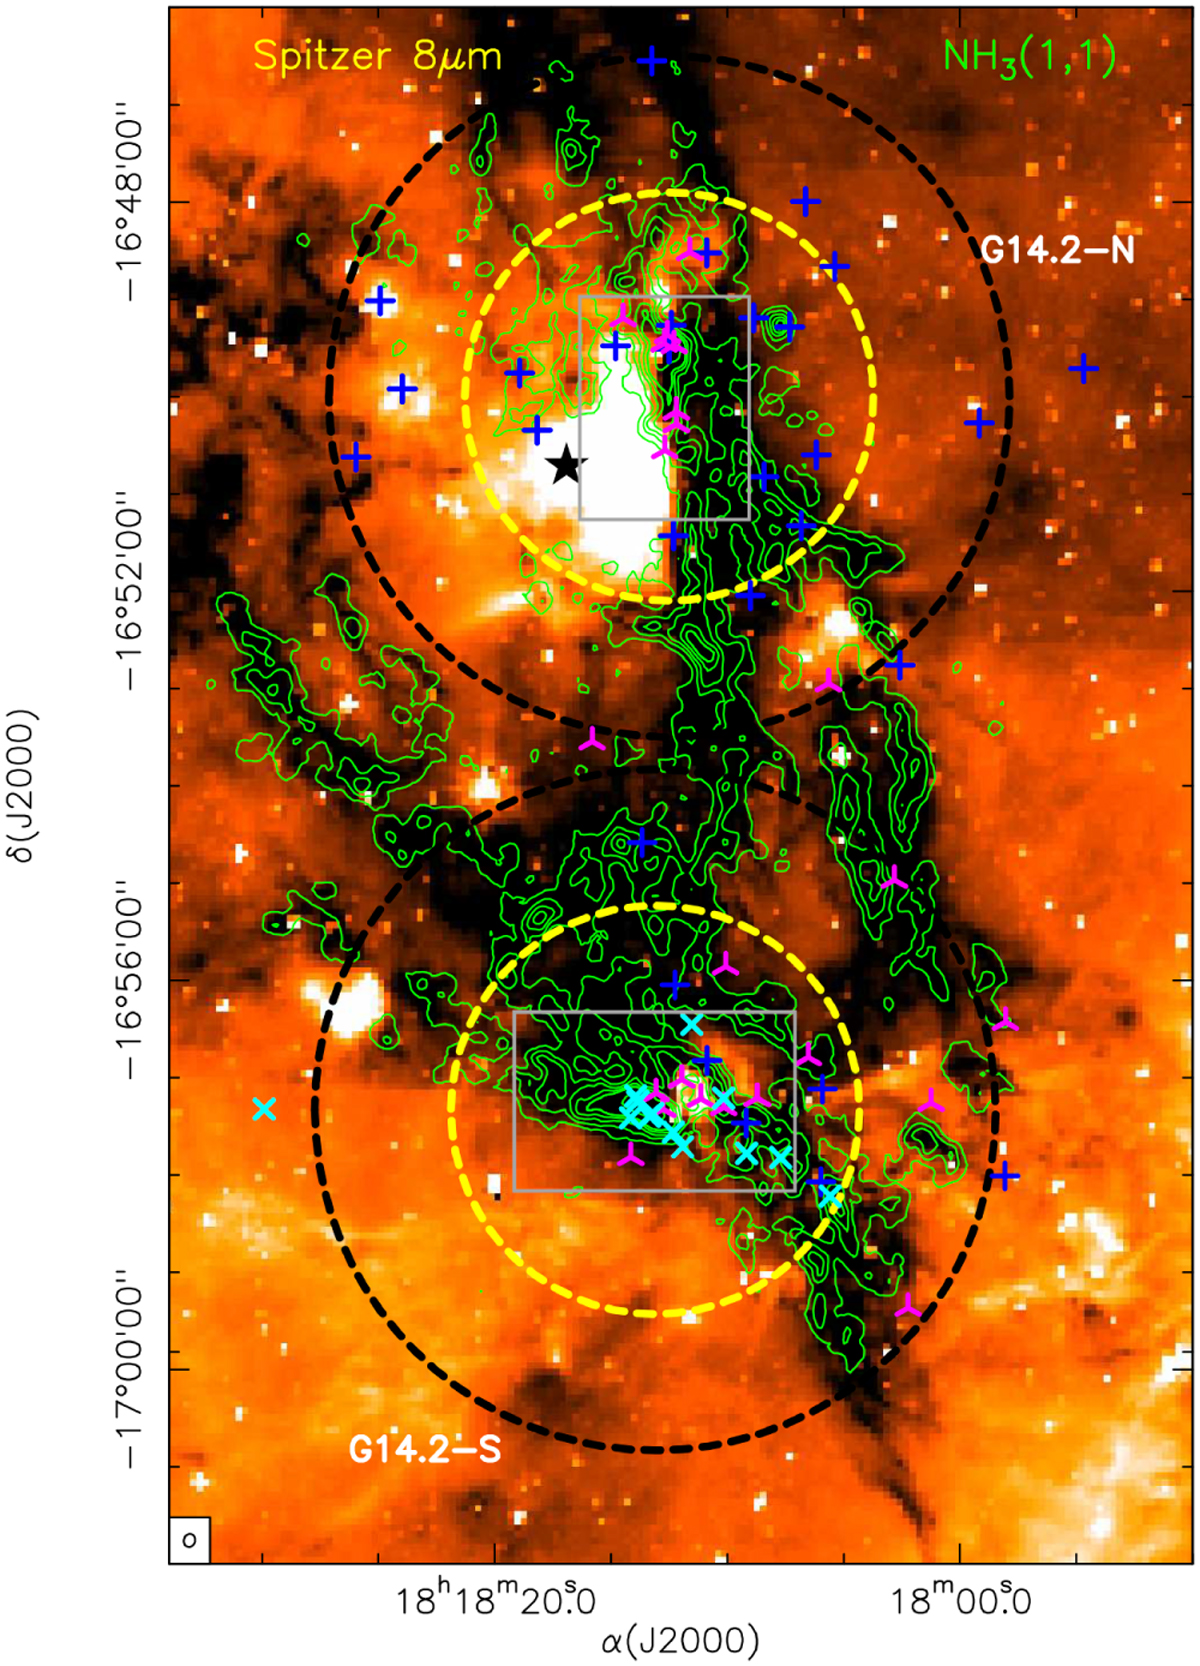
Spitzer image at 8 µm (color scale) overlaid on the NH3 (1,1) integrated intensity (green contours) from Busquet et al. (2013). The contour levels range from 3 to 27 in steps of 6, and from 27 to 67 in steps of 20 times the RMS noise of the map, 9 mJybeam−1 km s−1. The NH3 (1,1) synthesized beam is shown in the bottom left corner. The black star depicts the position of IRAS 18153–1651. Blue crosses and cyan four-point stars depict radio sources detected in this study only at 6 cm and 3.6 cm, respectively. Pink three-point stars indicate radio sources detected at both frequency bands. The black and yellow dashed circles represent the field of view at 6 cm (~7′ at 6 GHz) and 3.6 cm (~4.2′ at 10 GHz), respectively. The two observed fields in this work, G14.2-N and G14.2-S are labeled. The gray rectangles indicate the close-up images presented in Figs. 2 and 3.
Current usage metrics show cumulative count of Article Views (full-text article views including HTML views, PDF and ePub downloads, according to the available data) and Abstracts Views on Vision4Press platform.
Data correspond to usage on the plateform after 2015. The current usage metrics is available 48-96 hours after online publication and is updated daily on week days.
Initial download of the metrics may take a while.