Fig. 11.
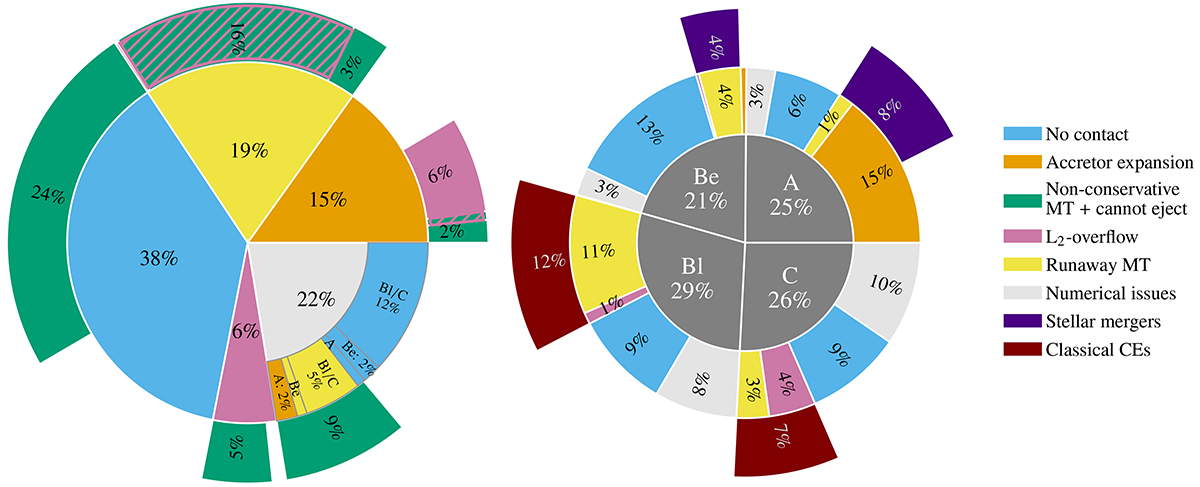
Download original image
Sunburst charts displaying the fractions of evolutionary outcomes for mass-transferring binary systems in the grid over initial primary mass ranges of [4.8; 20.8] M⊙. The left and right charts are equivalent to those in the top and bottom row of Fig. 10, respectively.
Current usage metrics show cumulative count of Article Views (full-text article views including HTML views, PDF and ePub downloads, according to the available data) and Abstracts Views on Vision4Press platform.
Data correspond to usage on the plateform after 2015. The current usage metrics is available 48-96 hours after online publication and is updated daily on week days.
Initial download of the metrics may take a while.