Fig. 1.
Download original image
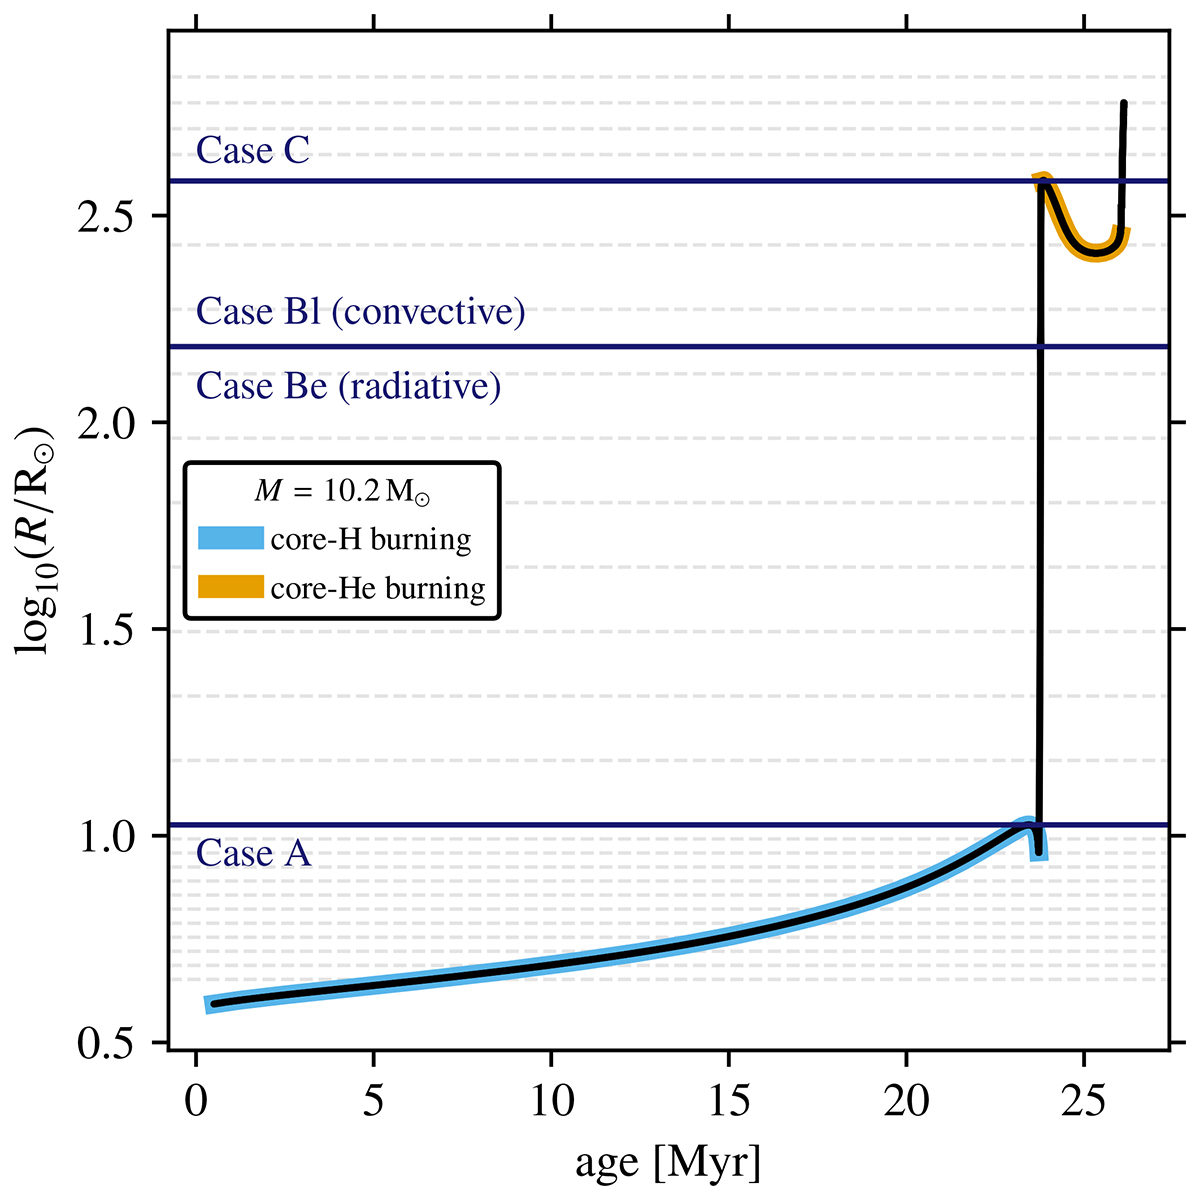
Radial expansion of a 10.2 M⊙ star (solid black line). The radial evolution is divided into different cases based on the main phases of expansion (solid horizontal lines). Each dashed horizontal line indicates a sample point at which we put R = RRL.
Current usage metrics show cumulative count of Article Views (full-text article views including HTML views, PDF and ePub downloads, according to the available data) and Abstracts Views on Vision4Press platform.
Data correspond to usage on the plateform after 2015. The current usage metrics is available 48-96 hours after online publication and is updated daily on week days.
Initial download of the metrics may take a while.