Fig. 8.
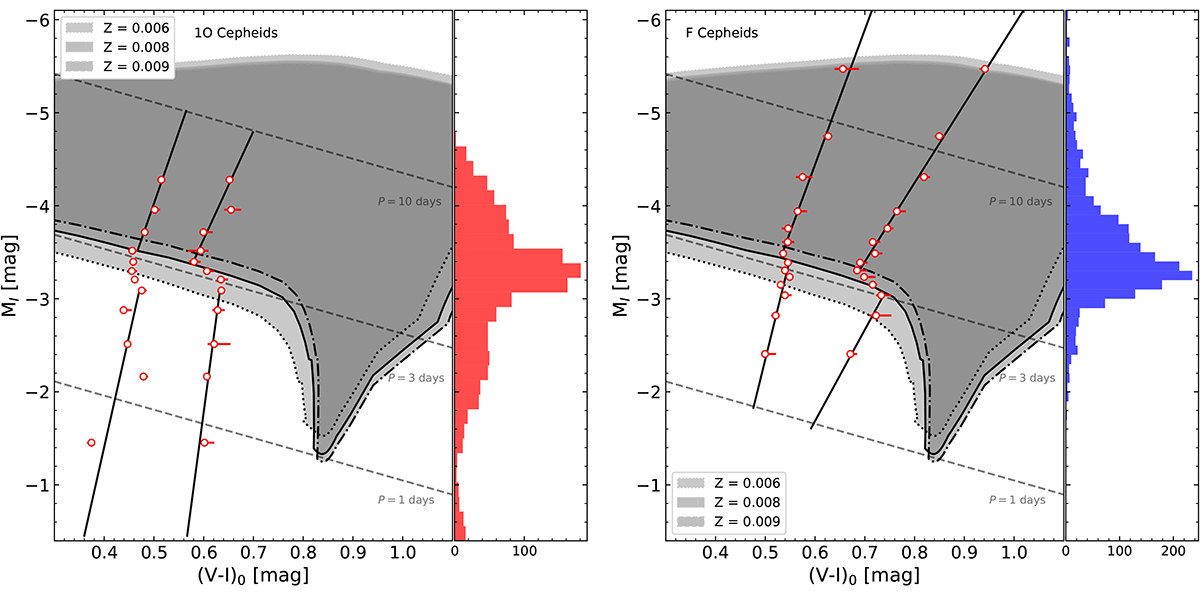
Download original image
CMD showing empirical IS limits (red points) separately for 1O (left panel) and F-mode (right panel) LMC Cepheids. Fits for the blue and red edges, considering a break at P ∼ 3 days, are shown as solid lines. Gray shaded areas mark the blue loop extent (delimited by its bluest extreme and the tip of the RGB) for evolutionary tracks with masses from 3 to 7 M⊙, and for Z = 0.006, 0.008, and 0.009. The upper limits for the areas are defined by the evolutionary tracks for 7 M⊙ and would extend further up if tracks with higher masses are considered. The I-band absolute magnitude distributions of the 1O and F LMC Cepheids are shown on the right side of each panel.
Current usage metrics show cumulative count of Article Views (full-text article views including HTML views, PDF and ePub downloads, according to the available data) and Abstracts Views on Vision4Press platform.
Data correspond to usage on the plateform after 2015. The current usage metrics is available 48-96 hours after online publication and is updated daily on week days.
Initial download of the metrics may take a while.