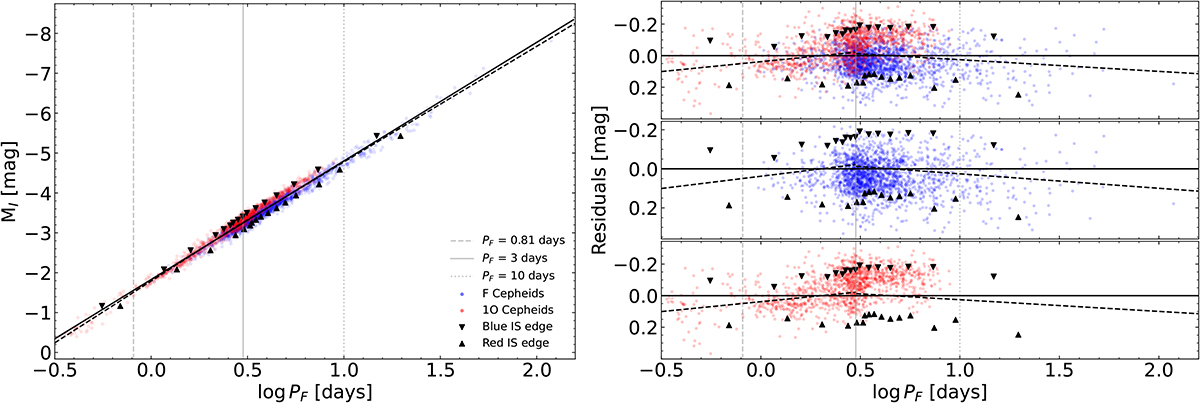
Fig. 7.
Download original image
P–L relation of F (blue points) and 1O (red points) LMC Cepheids (left panel). The 1O Cepheid periods were fundamentalized. The boundaries of the IS are displayed as black points. At PF = 0.81, 3, and 10 days, a vertical gray line is traced. Average fits of the P–L relation considering the entire sample of stars and with a break at PF = 3 days are shown as solid and dashed lines, respectively. The differences between the average fit of P–L with no break and the data are presented in the panels on the right, for the entire sample (upper), only F Cepheids (middle), and only 1O Cepheids (lower).
Current usage metrics show cumulative count of Article Views (full-text article views including HTML views, PDF and ePub downloads, according to the available data) and Abstracts Views on Vision4Press platform.
Data correspond to usage on the plateform after 2015. The current usage metrics is available 48-96 hours after online publication and is updated daily on week days.
Initial download of the metrics may take a while.