Fig. 11.
Download original image
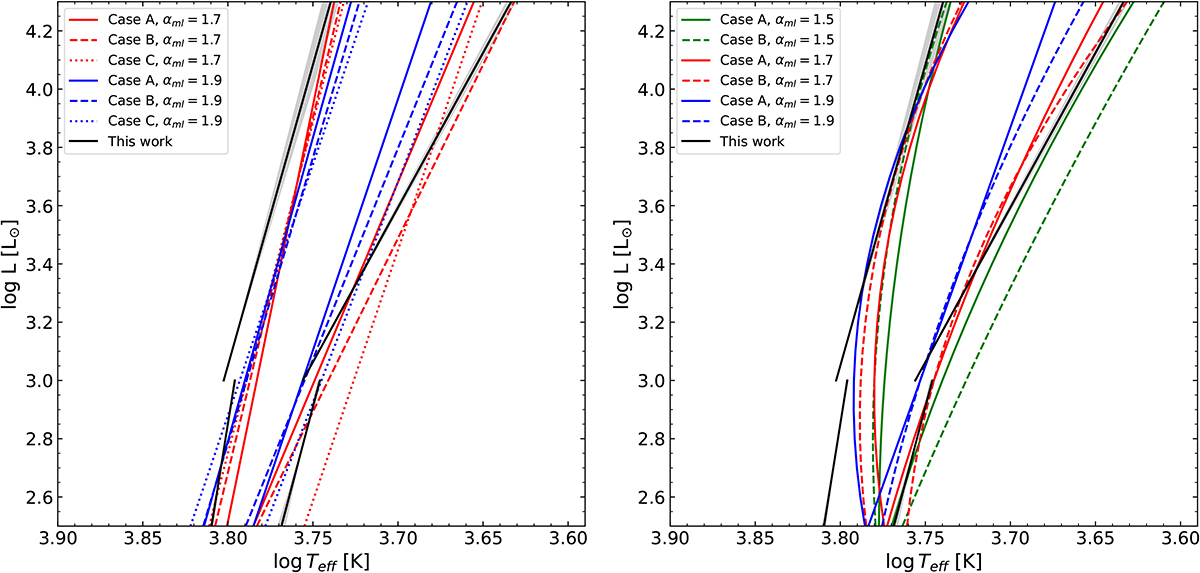
Comparison of theoretical ISs considering linear (left panel) and quadratic (right panel) relations for Z = 0.008 presented in De Somma et al. (2022; red, blue, and green) and our empirical IS (black) in an HRD. Different line styles represent different cases of the luminosity adjustment (increase) applied by the authors to their canonical model. Different colors represent different efficiencies of superadiabatic convection αml. Shaded areas represent one sigma errors on the edges.
Current usage metrics show cumulative count of Article Views (full-text article views including HTML views, PDF and ePub downloads, according to the available data) and Abstracts Views on Vision4Press platform.
Data correspond to usage on the plateform after 2015. The current usage metrics is available 48-96 hours after online publication and is updated daily on week days.
Initial download of the metrics may take a while.