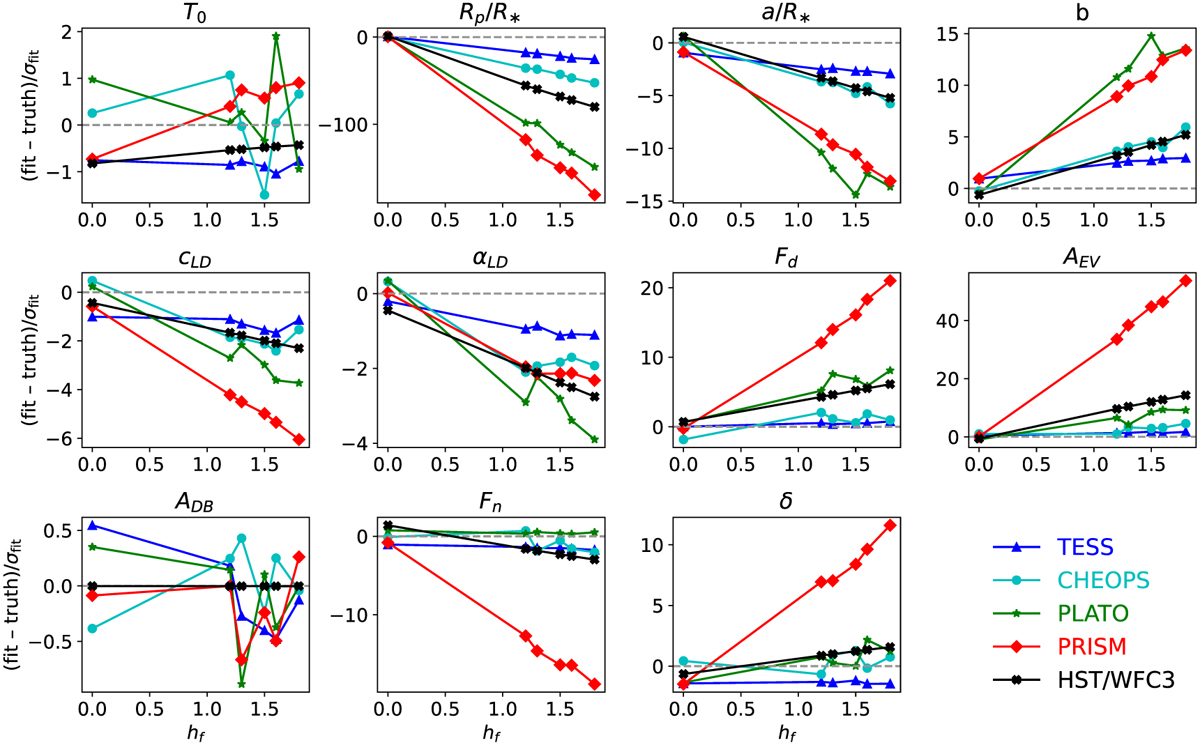
Fig. 8
Download original image
Parameter biases from fitting a spherical planet model to simulated phase curve of deformed planets of different h2f. The parameter names are given in Table 1. For each parameter, we compare the deviation of the fitted spherical planet parameters (fit) from the true input parameters of the deformed planet (truth) and scale this by the standard deviation of the fit (σfit). The colors show the biases for the different instruments.
Current usage metrics show cumulative count of Article Views (full-text article views including HTML views, PDF and ePub downloads, according to the available data) and Abstracts Views on Vision4Press platform.
Data correspond to usage on the plateform after 2015. The current usage metrics is available 48-96 hours after online publication and is updated daily on week days.
Initial download of the metrics may take a while.