Fig. 6
Download original image
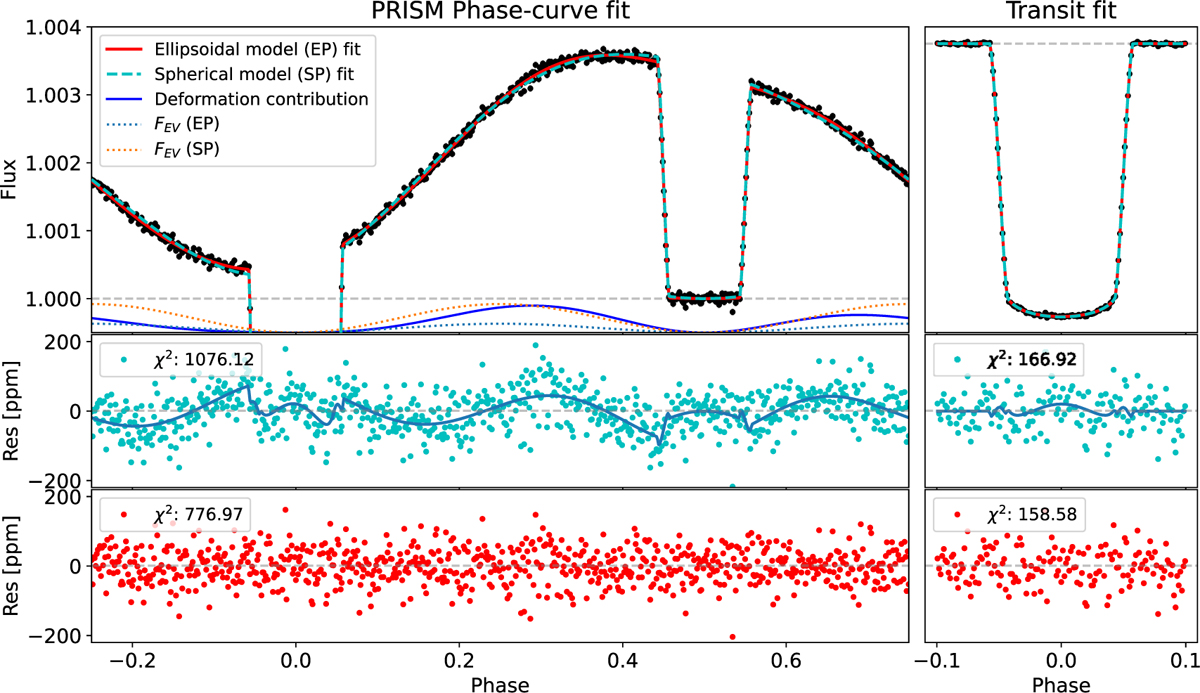
Spherical planet (SP) and ellipsoidal planet (EP) model fits to the simulated deformed planet signals with a PRISM noise level of 50 ppm/2 min. The top panel shows the simulated phase curve (left) and transit (right) observations with the fitted models overplotted. The phase curve fit also shows the contribution of deformation to the light curve (blue) and the FEV component of the EP and SP model fits. The middle and bottom panels show the residuals from fitting a spherical planet model (cyan) and an ellipsoidal planet model to the simulations.
Current usage metrics show cumulative count of Article Views (full-text article views including HTML views, PDF and ePub downloads, according to the available data) and Abstracts Views on Vision4Press platform.
Data correspond to usage on the plateform after 2015. The current usage metrics is available 48-96 hours after online publication and is updated daily on week days.
Initial download of the metrics may take a while.