Fig. 5
Download original image
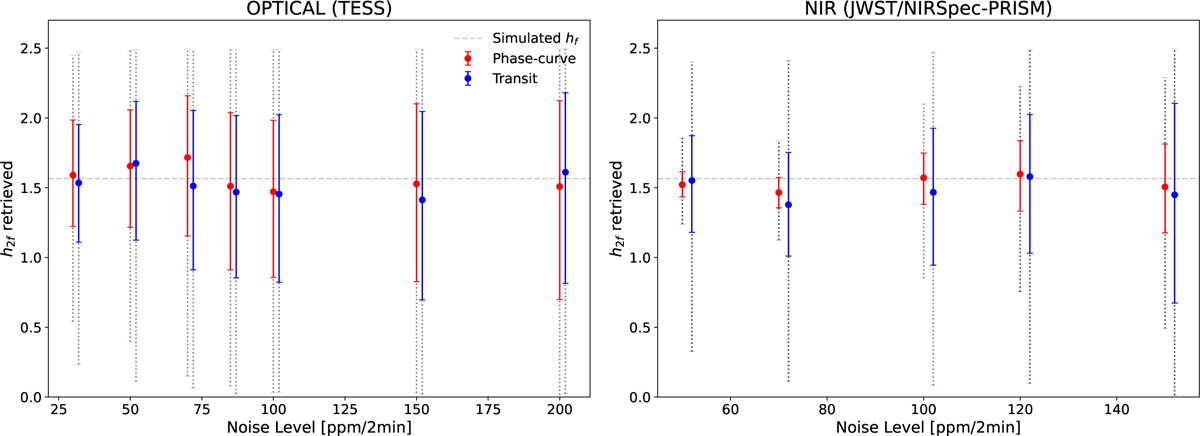
Detectability of deformation in the optical (TESS; left) and NIR (JWST/NIRSpec-PRISM; right). The horizontal dashed line indicates the simulated value of h2f =1.565. The red points show the retrieved value of h2f from phase curves and the 1σ uncertainty while the blue points show the retrieved h2f from transits. The gray dotted error bars show the 3σ uncertainty of the measurements. A similar plot for HST/WFC3 is shown in Fig. A.2.
Current usage metrics show cumulative count of Article Views (full-text article views including HTML views, PDF and ePub downloads, according to the available data) and Abstracts Views on Vision4Press platform.
Data correspond to usage on the plateform after 2015. The current usage metrics is available 48-96 hours after online publication and is updated daily on week days.
Initial download of the metrics may take a while.