Fig. 4
Download original image
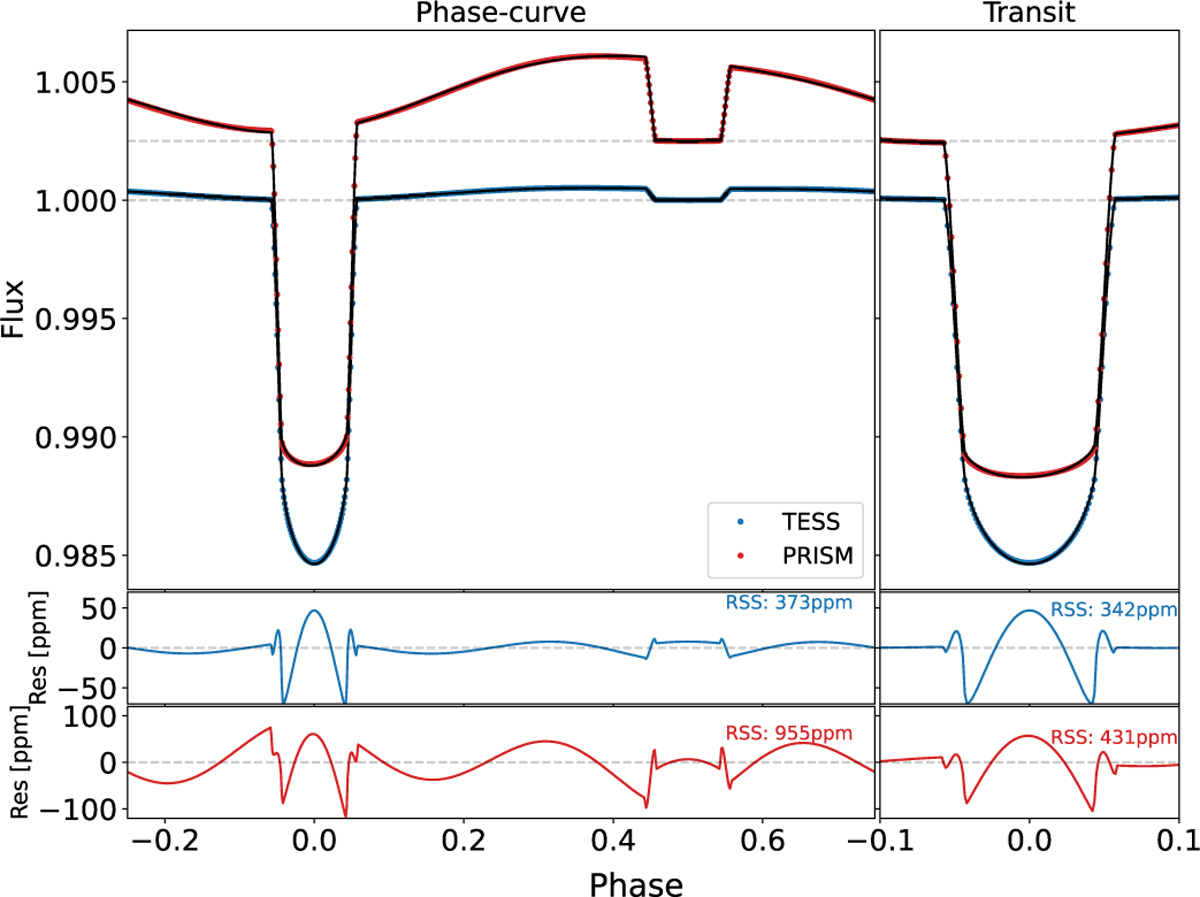
Fitting the phase curve and transit of a deformed planet with a spherical planet model. Left: simulated deformed planet phase curve of WASP-12 b in the TESS (blue) and NIRSpec-PRISM (red) bands. The spherical planet model fit is overplotted for each light curve. The bottom panel shows the residuals of the fit for each light curve. Right: same as the left panel, but for observation of the transit only. The residuals are shown in the bottom panel for each light curve with the root sum of squares (RSS) quoted.
Current usage metrics show cumulative count of Article Views (full-text article views including HTML views, PDF and ePub downloads, according to the available data) and Abstracts Views on Vision4Press platform.
Data correspond to usage on the plateform after 2015. The current usage metrics is available 48-96 hours after online publication and is updated daily on week days.
Initial download of the metrics may take a while.