Fig. 6.
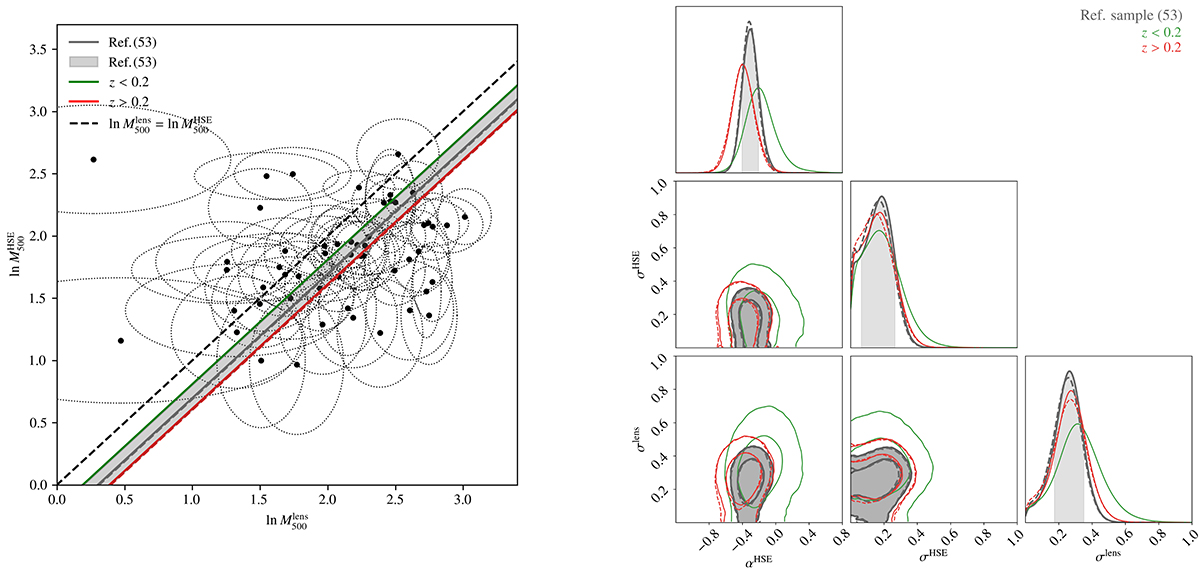
Download original image
Scaling relation between HSE and lensing masses for the reference sample in grey and for different subsamples in colours, all accounting for σsys. Here βHSE is fixed to 1. As in Fig. 4, we only show the cases for z > 0.2 and z < 0.2. Data points with ellipses represent each cluster masses and uncertainties in both axes accounting for the systematic scatters. The black dashed line shows the equality. The corner plots in the right panel are the posterior 1D and 2D distributions of the parameters in the SR.
Current usage metrics show cumulative count of Article Views (full-text article views including HTML views, PDF and ePub downloads, according to the available data) and Abstracts Views on Vision4Press platform.
Data correspond to usage on the plateform after 2015. The current usage metrics is available 48-96 hours after online publication and is updated daily on week days.
Initial download of the metrics may take a while.