Fig. 4.
Download original image
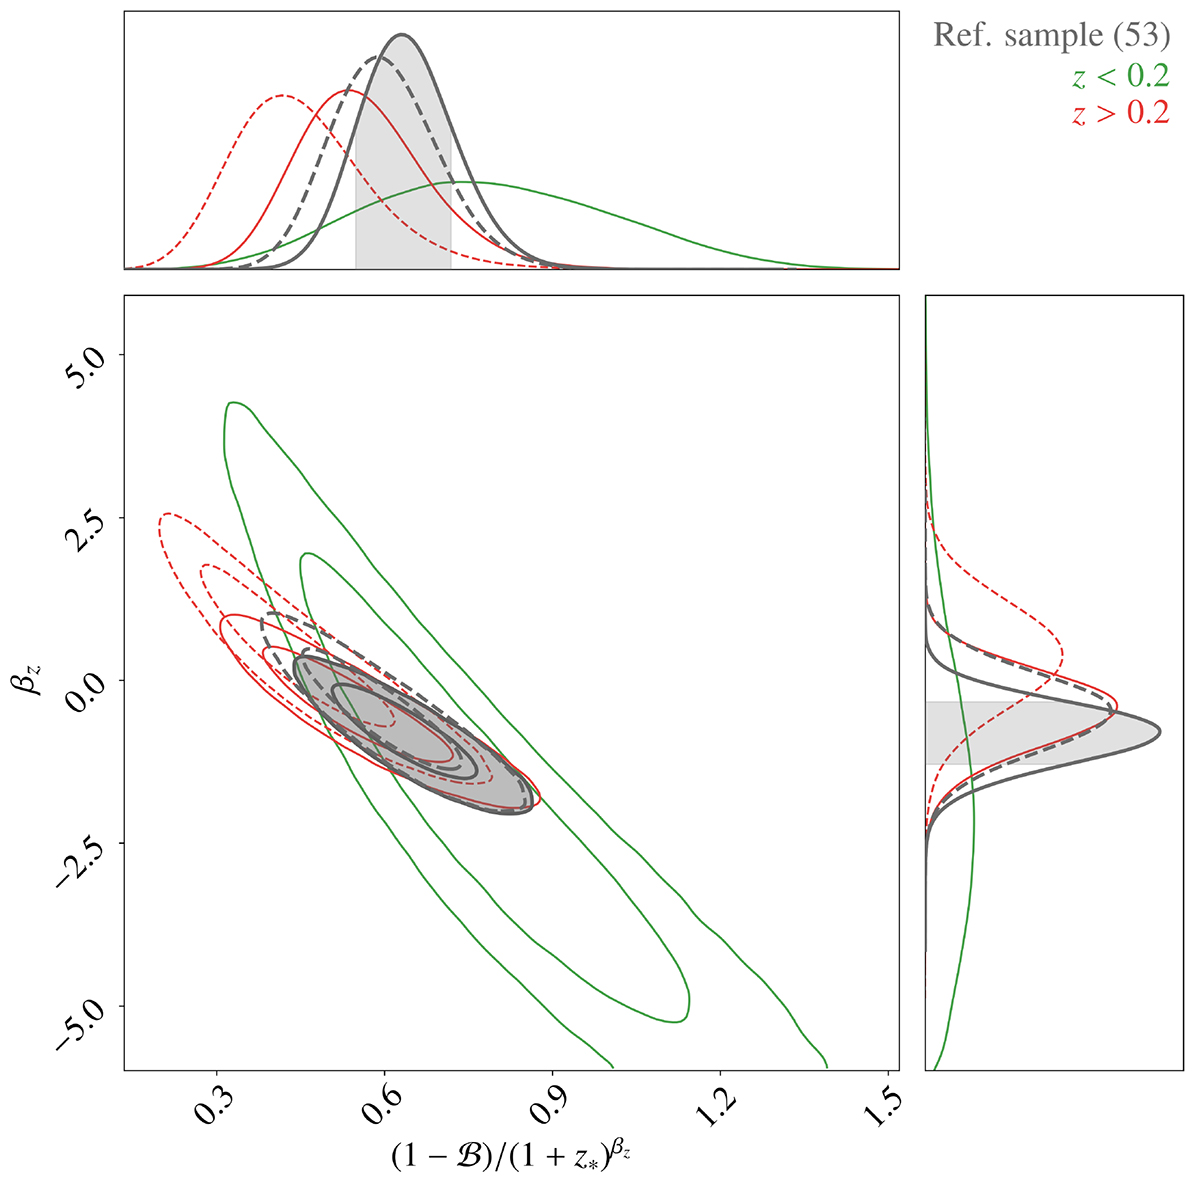
One-dimensional and two-dimensional posterior distributions of the parameters in the redshift dependent mass bias model, accounting for the ![]() in the error bars. Different colours describe the results for the various samples presented in Table 2. For a good visualisation, we only show in grey, green, and red the results for the whole sample, the z < 0.2, and the z > 0.2 ranges, respectively. Dashed distributions have been obtained excluding CL J1226.9+3332 galaxy cluster.
in the error bars. Different colours describe the results for the various samples presented in Table 2. For a good visualisation, we only show in grey, green, and red the results for the whole sample, the z < 0.2, and the z > 0.2 ranges, respectively. Dashed distributions have been obtained excluding CL J1226.9+3332 galaxy cluster.
Current usage metrics show cumulative count of Article Views (full-text article views including HTML views, PDF and ePub downloads, according to the available data) and Abstracts Views on Vision4Press platform.
Data correspond to usage on the plateform after 2015. The current usage metrics is available 48-96 hours after online publication and is updated daily on week days.
Initial download of the metrics may take a while.