Fig. 2.
Download original image
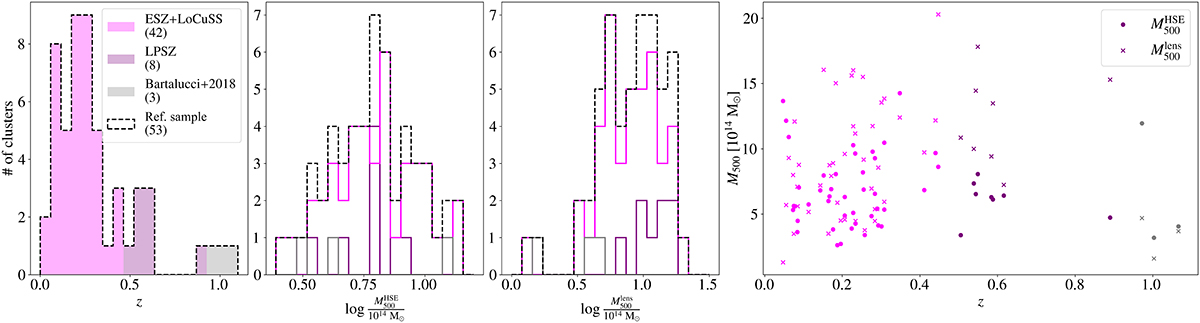
Main characteristics of the 53 clusters in the reference sample. Histograms in the left panels show the redshift, HSE mass, and lensing mass distributions. We show in purple, magenta, and grey the distributions for ESZ+LoCuSS, LPSZ, and Bartalucci+2018 clusters, respectively. The black dashed lines represent the distributions of the whole sample. In the right panel we show the HSE and lensing masses as a function of redshift for all the clusters.
Current usage metrics show cumulative count of Article Views (full-text article views including HTML views, PDF and ePub downloads, according to the available data) and Abstracts Views on Vision4Press platform.
Data correspond to usage on the plateform after 2015. The current usage metrics is available 48-96 hours after online publication and is updated daily on week days.
Initial download of the metrics may take a while.