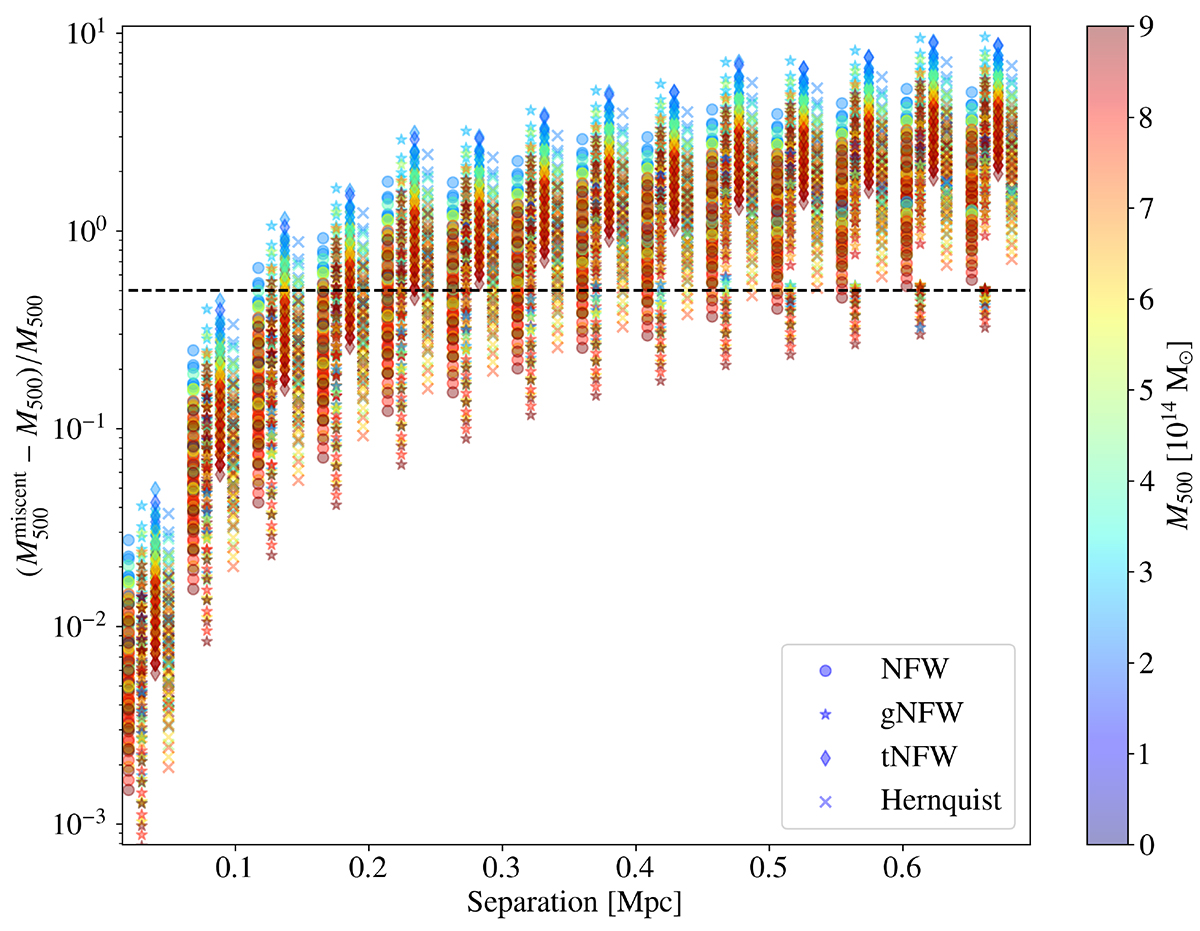
Fig. B.2.
Download original image
Relative error of M500 with respect to the separation between the true and the considered centre for the mass reconstruction. Colours indicate the true M500 and markers the mass density model. We consider the same separation for the four models, but gNFW, tNFW, and Hernquist markers have been shifted for visualisation purposes. The black dashed line indicates a 50% error in M500.
Current usage metrics show cumulative count of Article Views (full-text article views including HTML views, PDF and ePub downloads, according to the available data) and Abstracts Views on Vision4Press platform.
Data correspond to usage on the plateform after 2015. The current usage metrics is available 48-96 hours after online publication and is updated daily on week days.
Initial download of the metrics may take a while.