Open Access
Fig. B.1.
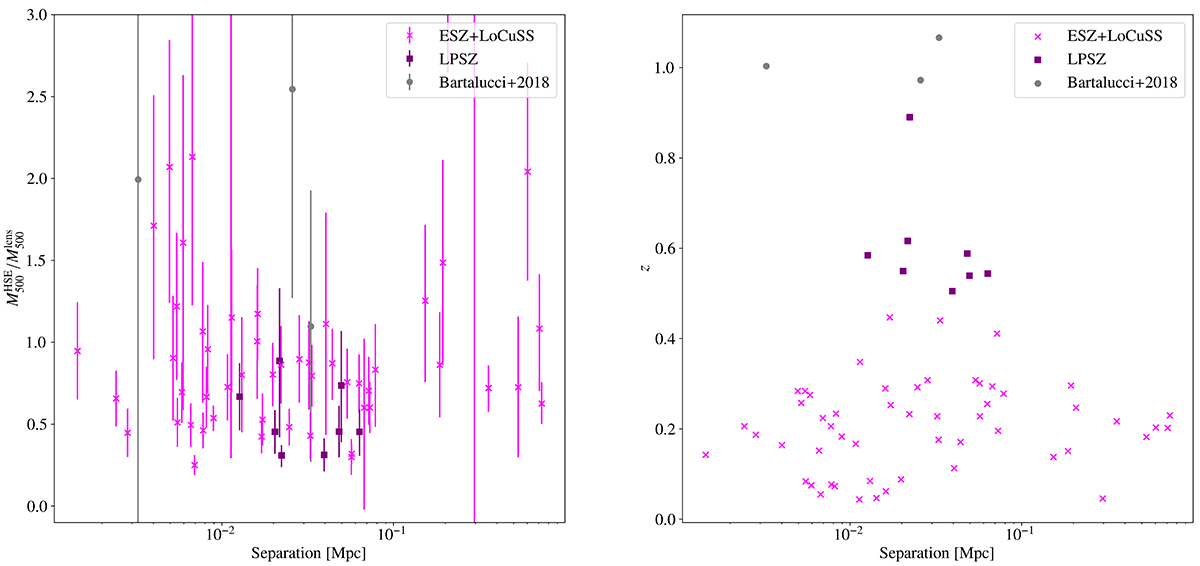
Download original image
Correlation between the HSE-to-lensing mass ratio (left) and redshift (right) of the 65 clusters in the XMM-Newton-CoMaLit homogeneous sample with respect to the separation between the centres assumed in the X-ray and lensing analyses. Error bars in the left panel do not account for the systematic scatters.
Current usage metrics show cumulative count of Article Views (full-text article views including HTML views, PDF and ePub downloads, according to the available data) and Abstracts Views on Vision4Press platform.
Data correspond to usage on the plateform after 2015. The current usage metrics is available 48-96 hours after online publication and is updated daily on week days.
Initial download of the metrics may take a while.