Fig. 11.
Download original image
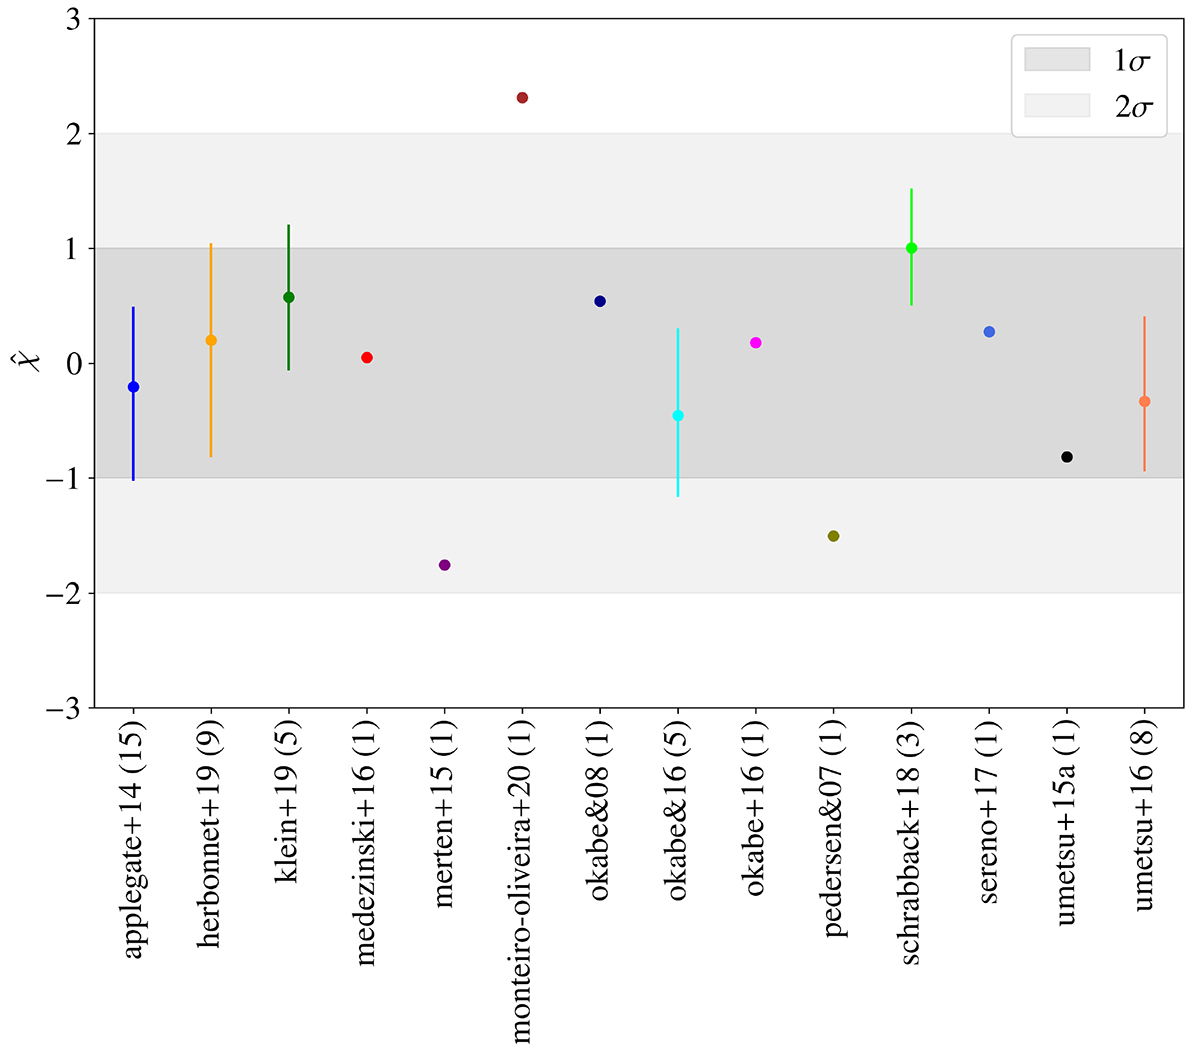
Values of ![]() for the clusters in the reference sample with respect to the reference scaling relation. We distinguish the results from the various lensing works used to build the CoMaLit sample with different colour markers. The number of clusters used in the reference sample from each of the works is indicated in brackets. For works with multiple clusters, we give the mean
for the clusters in the reference sample with respect to the reference scaling relation. We distinguish the results from the various lensing works used to build the CoMaLit sample with different colour markers. The number of clusters used in the reference sample from each of the works is indicated in brackets. For works with multiple clusters, we give the mean ![]() and the 16th to 84th percentiles over all those clusters. Grey shaded areas indicate 1σ and 2σ regions.
and the 16th to 84th percentiles over all those clusters. Grey shaded areas indicate 1σ and 2σ regions.
Current usage metrics show cumulative count of Article Views (full-text article views including HTML views, PDF and ePub downloads, according to the available data) and Abstracts Views on Vision4Press platform.
Data correspond to usage on the plateform after 2015. The current usage metrics is available 48-96 hours after online publication and is updated daily on week days.
Initial download of the metrics may take a while.