Fig. 10.
Download original image
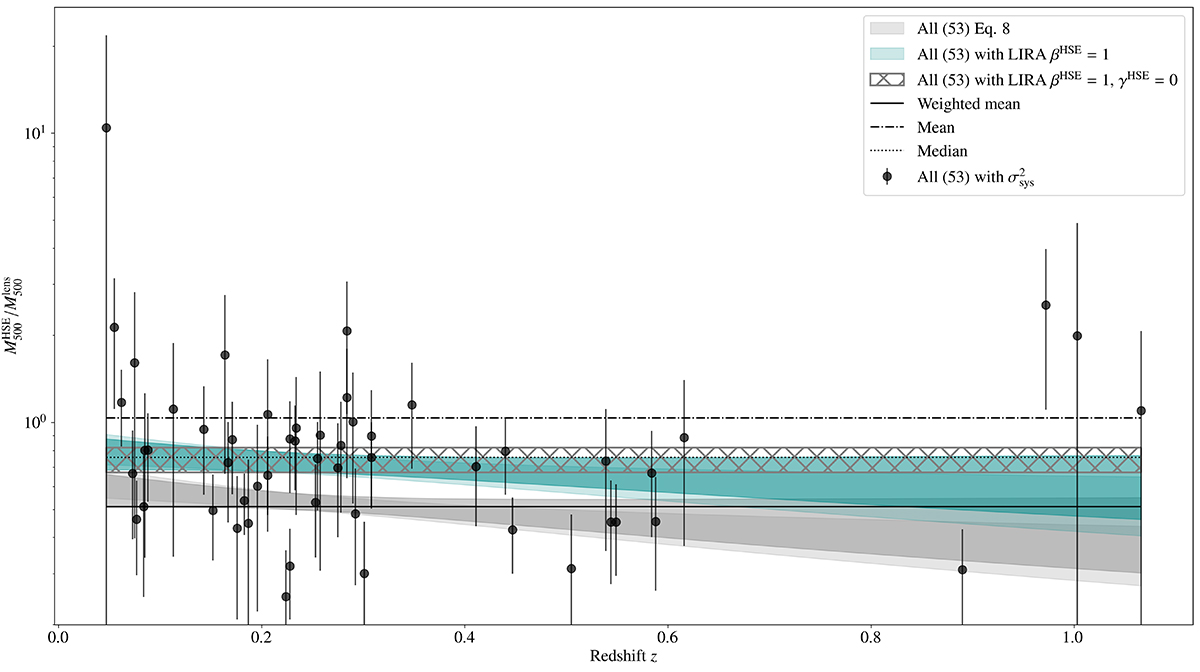
HSE-to-lensing mass ratio with respect to redshift. The grey shaded area shows the evolution from Fig. 3 for all the clusters in the sample and in darker excluding CL J1226.9+3332. The blue area gives the evolution with redshift obtained from the fit of the scaling relation with the reference sample and the grey hatched area without considering the redshift evolution. The blue dark area is the evolution obtained for the reference sample excluding CL J1226.9+3332. As in Fig. 3, markers with error bars show the ratio per cluster in the reference sample with error bars accounting for the systematic uncertainty. Horizontal solid, dotted, and dash-dotted black lines give respectively the weighted mean, median, and mean mass ratio for the data points.
Current usage metrics show cumulative count of Article Views (full-text article views including HTML views, PDF and ePub downloads, according to the available data) and Abstracts Views on Vision4Press platform.
Data correspond to usage on the plateform after 2015. The current usage metrics is available 48-96 hours after online publication and is updated daily on week days.
Initial download of the metrics may take a while.