Fig. 9
Download original image
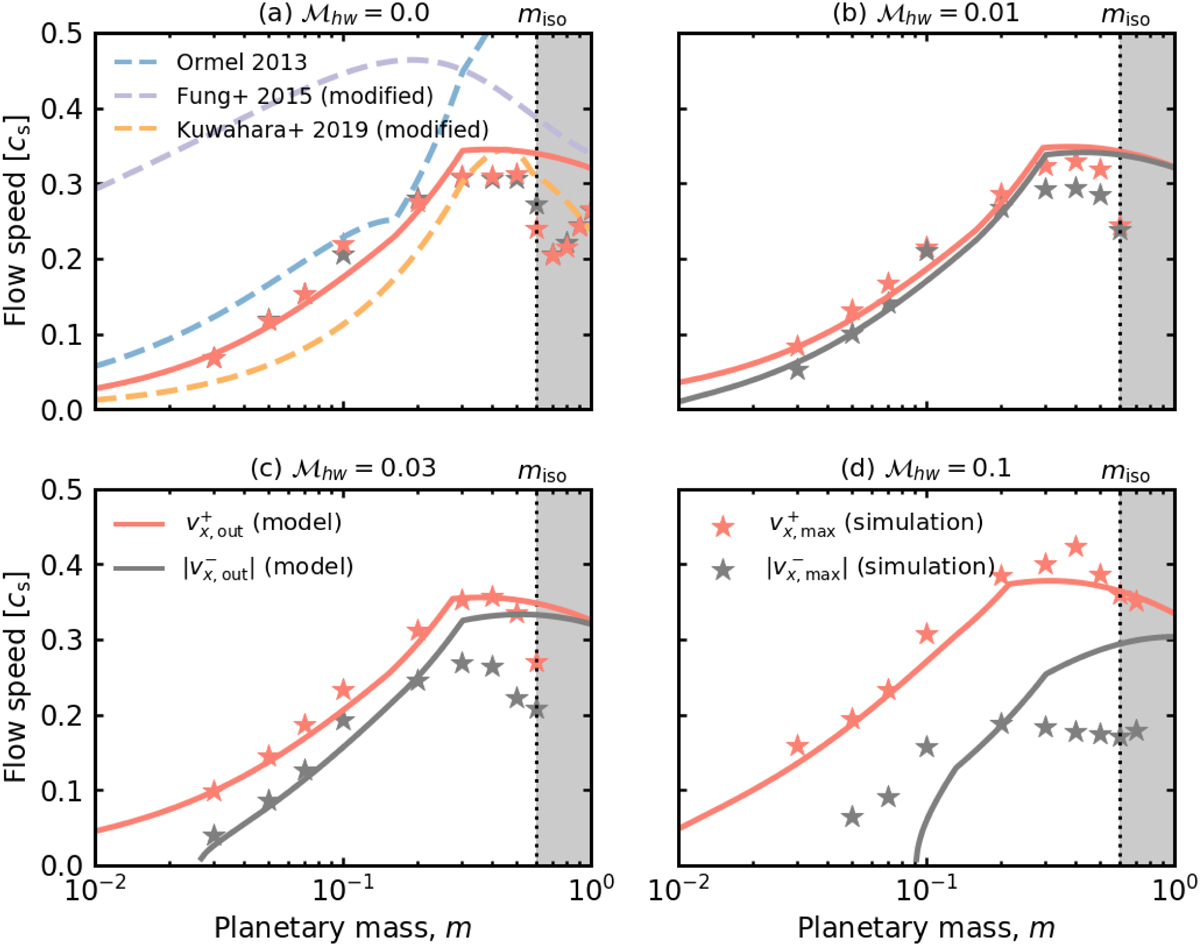
Outflow speed at the midplane as a function of the dimensionless planetary mass and the Mach number of the headwind of the gas. The star symbols were obtained from hydrodynamical simulations, corresponding to the maximum flow speeds in the x-direction toward the outside (red) and inside (black) of the planetary orbit within the limited region, ![]() , and
, and ![]() . The last condition avoids incorrectly sampling the large υx,g within the atmosphere. The solid red and black lines correspond to the analytic formulae for the x-components of the outflow speeds (Eq. (27)). The dashed lines correspond to the analytic formulae for the outflow speed in the x-direction obtained by Ormel (2013, blue; Eq. (38)), Fung et al. (2015, purple; Eq. (41)), and Kuwahara et al. (2019, yellow; Eq. (43)). The gray shading marks the region where the planetary mass exceeds the pebble isolation mass, miso (Eq. (12)).
. The last condition avoids incorrectly sampling the large υx,g within the atmosphere. The solid red and black lines correspond to the analytic formulae for the x-components of the outflow speeds (Eq. (27)). The dashed lines correspond to the analytic formulae for the outflow speed in the x-direction obtained by Ormel (2013, blue; Eq. (38)), Fung et al. (2015, purple; Eq. (41)), and Kuwahara et al. (2019, yellow; Eq. (43)). The gray shading marks the region where the planetary mass exceeds the pebble isolation mass, miso (Eq. (12)).
Current usage metrics show cumulative count of Article Views (full-text article views including HTML views, PDF and ePub downloads, according to the available data) and Abstracts Views on Vision4Press platform.
Data correspond to usage on the plateform after 2015. The current usage metrics is available 48-96 hours after online publication and is updated daily on week days.
Initial download of the metrics may take a while.