Fig. 8
Download original image
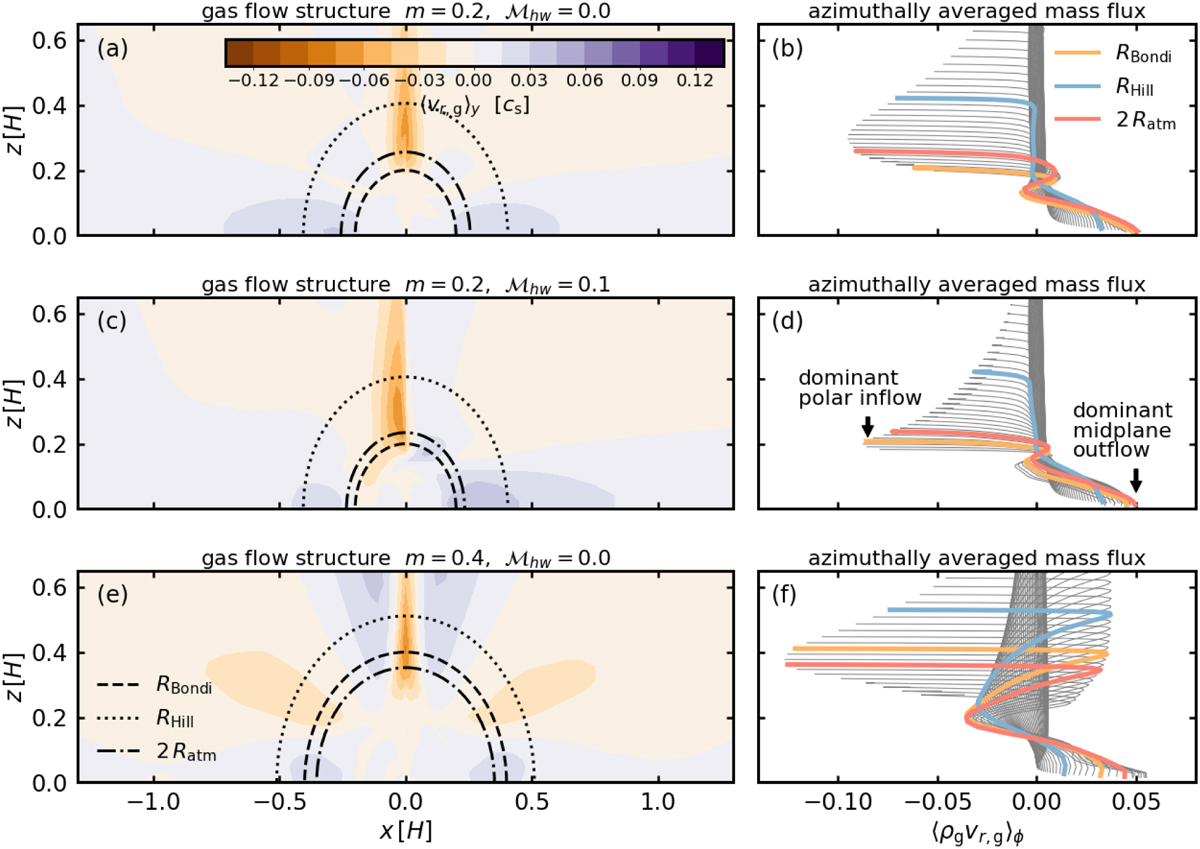
Gas flow structure and azimuthally averaged mass flux. The results were obtained from m02 − hw0 (panels a and b), m02 − hw01 (panels c and d), and m04 − hw0 (panels e and f). Left column: gas flow structure at the meridian plane. The color contour represents the r-component of the gas velocity in the spherical polar coordinates centered at the planet and averaged in the y-direction within the calculation domain of the hydrodynamical simulation. The dashed, dotted, and dashed-dotted circles denote the Bondi radius, the Hill radius, and twice the atmospheric radius, respectively. Right column: mass flux of the gas averaged in the azimuthal direction in the spherical polar coordinates centered at the planet, 〈ρgυr〉ϕ. Each solid line represents the changes in 〈ρgυr〉ϕ; altitude is varied along with a certain radius. We highlight the important radii with solid yellow (RBondi), blue (RHill), and red (2 Ratm) lines.
Current usage metrics show cumulative count of Article Views (full-text article views including HTML views, PDF and ePub downloads, according to the available data) and Abstracts Views on Vision4Press platform.
Data correspond to usage on the plateform after 2015. The current usage metrics is available 48-96 hours after online publication and is updated daily on week days.
Initial download of the metrics may take a while.