Fig. 4
Download original image
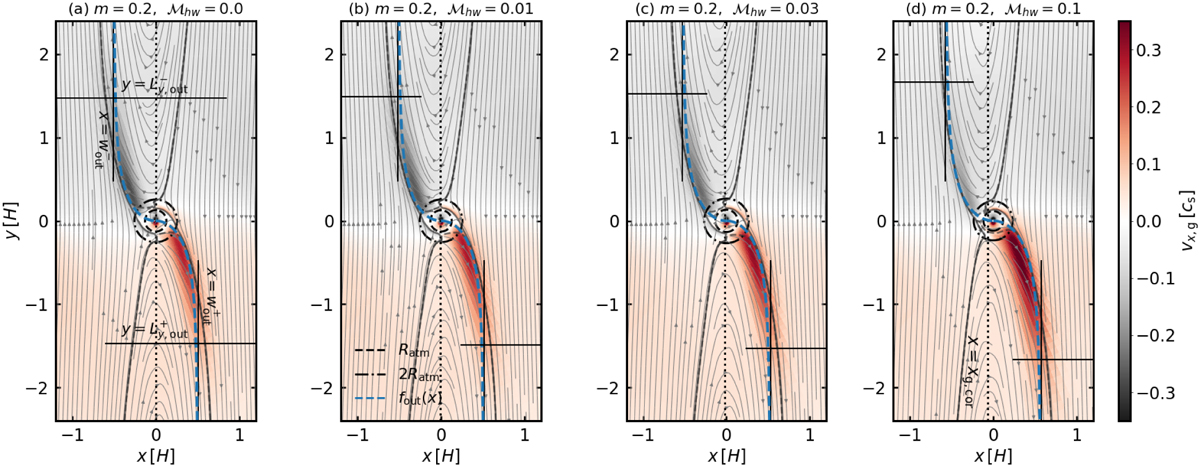
Same as Fig. 3, but showing the dependence of the planet-induced gas flow on the Mach number of the headwind. We set m = 0.2 in all panels. The results were obtained from m02-hw0 (panel a), m02-hw001 (panel b), m02-hw003 (panel c), and m02-hw01 (panel d). The vertical dotted line corresponds to the corotation radius for the gas.
Current usage metrics show cumulative count of Article Views (full-text article views including HTML views, PDF and ePub downloads, according to the available data) and Abstracts Views on Vision4Press platform.
Data correspond to usage on the plateform after 2015. The current usage metrics is available 48-96 hours after online publication and is updated daily on week days.
Initial download of the metrics may take a while.