Fig. 3
Download original image
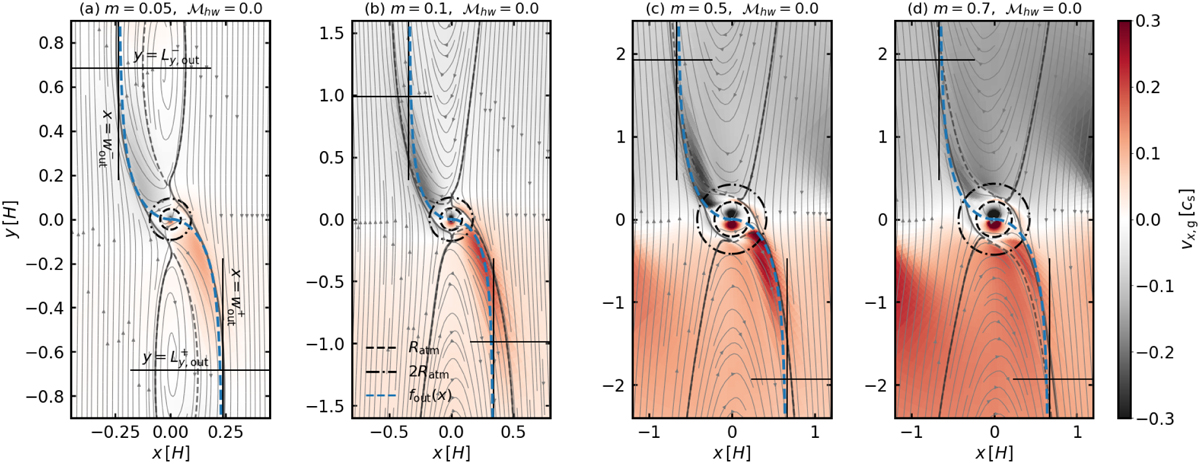
Dependence of the planet-induced gas flow on the planetary mass at the midplane. We set ℳhw = 0 in all panels. The results were obtained from m005-hw0 (panel a), m01-hw0 (panel b), m05-hw0 (panel c), and m07-hw0 (panel d). The solid thin gray lines are gas streamlines. The solid and thick dashed gray lines are the widest horseshoe streamline and the shear streamline passing closest to the planet, respectively (Appendix E). The color contour represents the flow speed in the x-direction. The dashed and dashed-dotted black circles denote the atmospheric radius (Eq. (5)) and twice the atmospheric radius, where the outflow speed is measured. The dashed blue lines are the curves representing the fitting formula for the critical recycling streamline (Eq. (11); Sect. 3.2.1). The vertical lines are the asymptotes of Eq. (11), representing the extent of the outflow region in the x-direction ((Eq. (17)); Sect. 3.2.2). The horizontal lines denote the y-coordinates of the characteristic length of the outflow region in the y-direction ((Eq. (18)); Sect. 3.2.3).
Current usage metrics show cumulative count of Article Views (full-text article views including HTML views, PDF and ePub downloads, according to the available data) and Abstracts Views on Vision4Press platform.
Data correspond to usage on the plateform after 2015. The current usage metrics is available 48-96 hours after online publication and is updated daily on week days.
Initial download of the metrics may take a while.