Fig. 17
Download original image
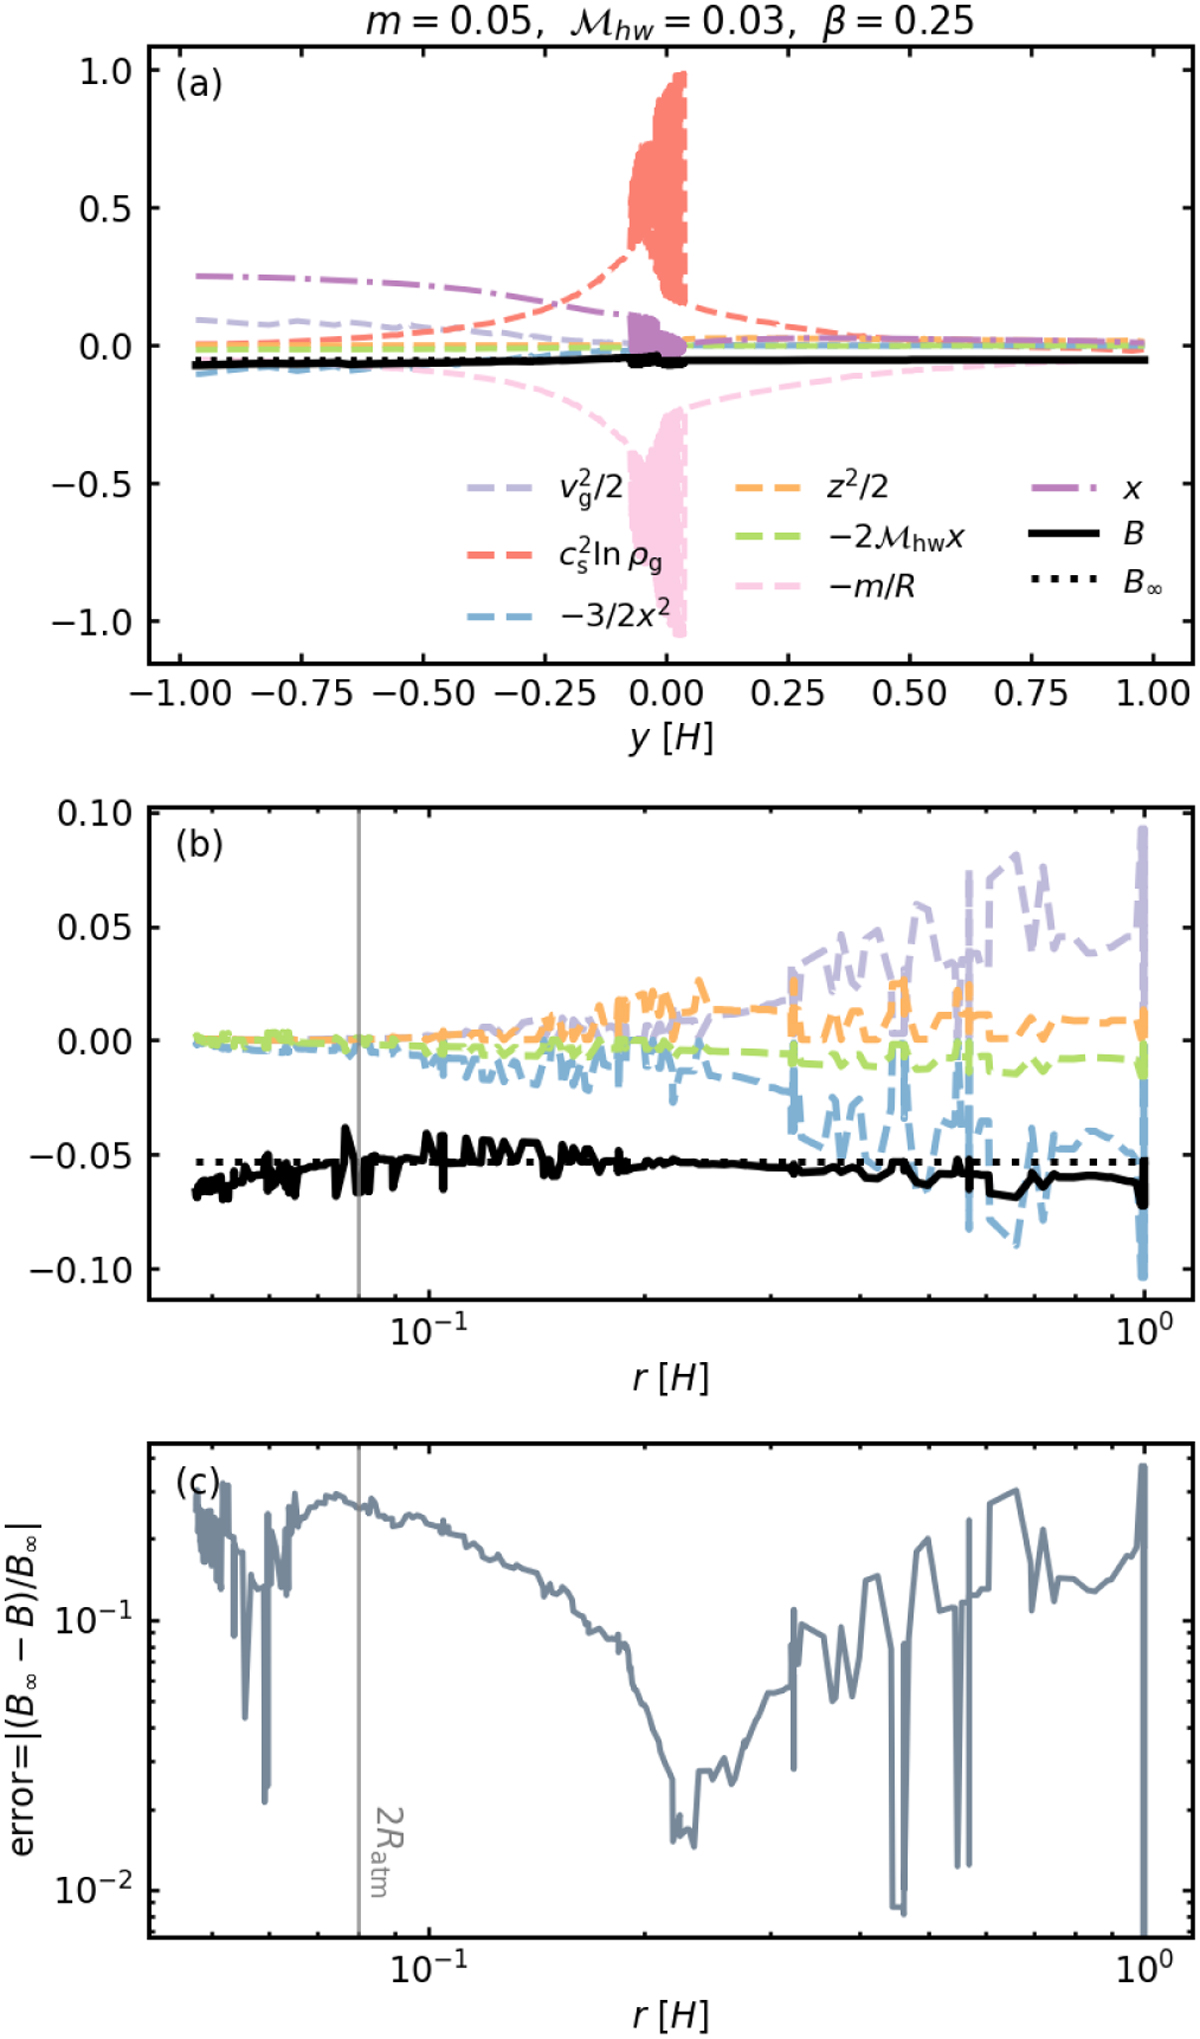
Quantities (panels a and b) and the relative error between ℬ and ℬ∞ (panel c) along a streamline through (x, y, z) = (0.001,0.01,0.2) (the solid colored line shown in Fig. 2c). The results were obtained from m005-hw003. Panels a and b: the solid and dotted black lines represent Bernoulli’s function, ℬ, and that in the far field, ℬ∞. The colored dashed lines correspond to the first to sixth terms in Bernoulli’s function. The dashed-dotted purple line in panel a corresponds to the x-coordinate of the streamline. The vertical solid lines in panels b and c denote twice the atmospheric radius. This figure should be compared to Fig. 2c.
Current usage metrics show cumulative count of Article Views (full-text article views including HTML views, PDF and ePub downloads, according to the available data) and Abstracts Views on Vision4Press platform.
Data correspond to usage on the plateform after 2015. The current usage metrics is available 48-96 hours after online publication and is updated daily on week days.
Initial download of the metrics may take a while.