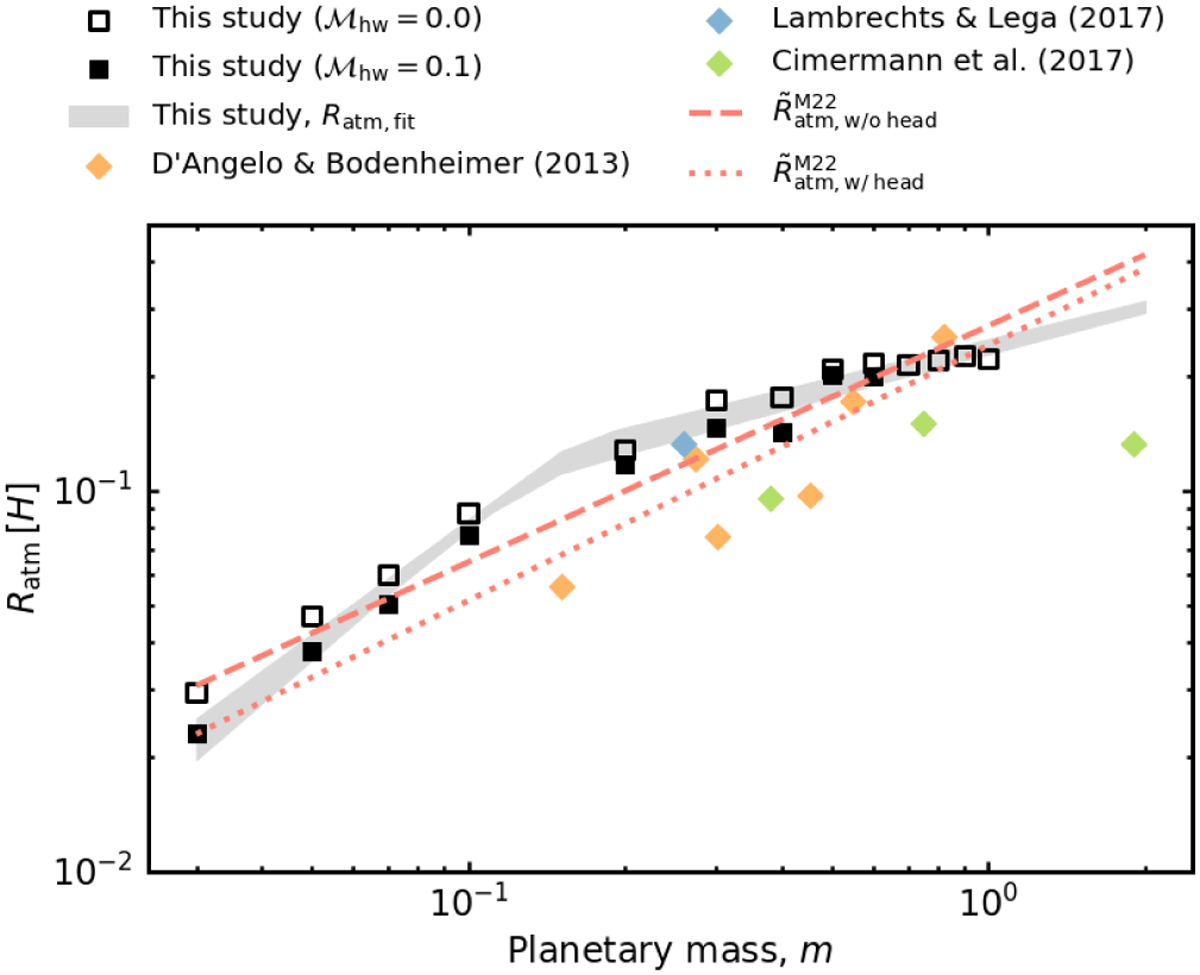
Fig. 15
Download original image
Comparison of the atmospheric radii obtained in our study and those in previous studies. The open and filled square symbols were obtained from our hydrodynamical simulations, ℳhw = 0 and 0.1, respectively. The gray-shaded region is given by the fitting formula for the atmospheric radius, Ratm,fit (Eq. (7)). The red dashed and dotted lines are given by Eq. (34) (Moldenhauer et al. 2022). We extrapolated Eq. (34) to the range of m ≤ 0.3. The yellow, blue, and green diamonds corresponds to the results of D’Angelo & Bodenheimer (2013), Lambrechts & Lega (2017), and Cimerman et al. (2017), respectively. To plot the results of D’Angelo & Bodenheimer (2013), the atmospheric radii were calculated by Ratm/H = CDB13a/H = CDB13/h. The values of CDB13 = 2.6 × 10⁻³−9.6 × 10⁻³ were given in Table 3 of D’Angelo & Bodenheimer (2013). We used h = max(0.027(a/1 au)1/20, 0.024 (a/1 au)2/7) (Appendix A).
Current usage metrics show cumulative count of Article Views (full-text article views including HTML views, PDF and ePub downloads, according to the available data) and Abstracts Views on Vision4Press platform.
Data correspond to usage on the plateform after 2015. The current usage metrics is available 48-96 hours after online publication and is updated daily on week days.
Initial download of the metrics may take a while.