Fig. 14
Download original image
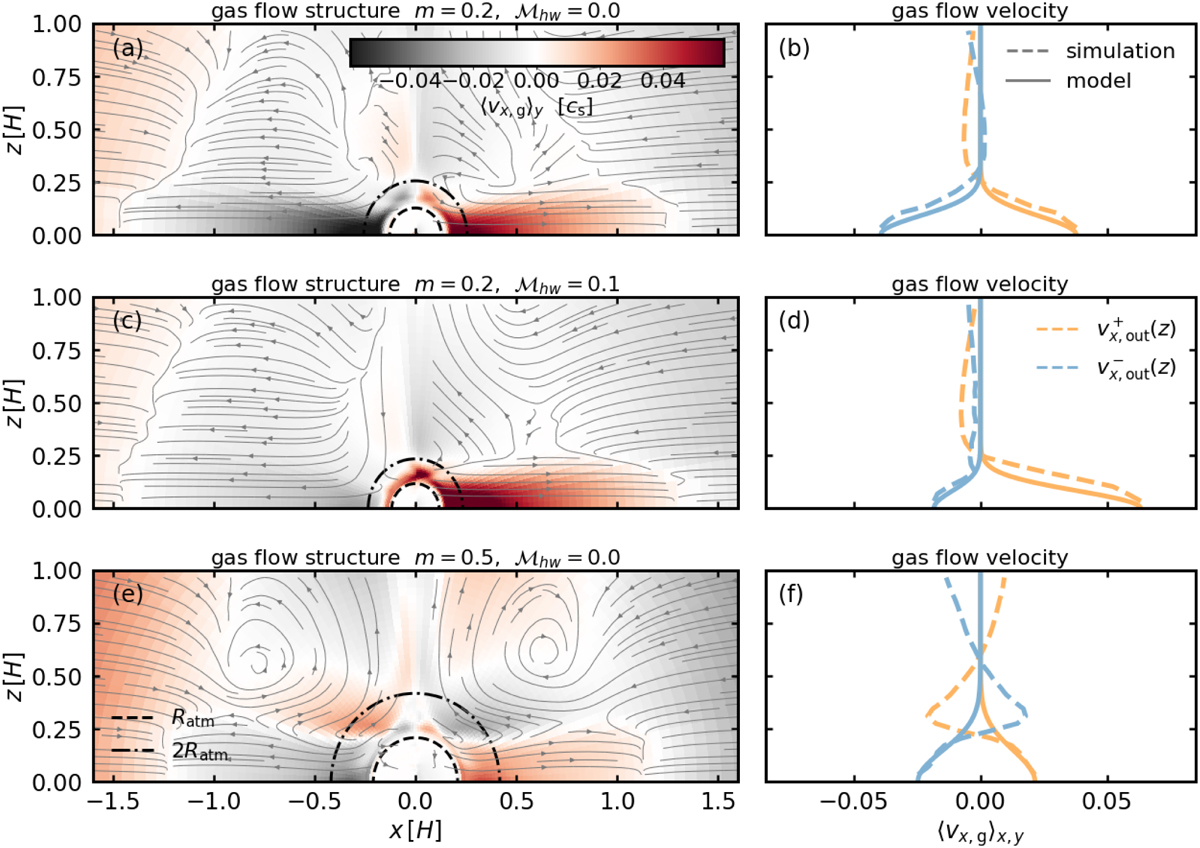
Vertical structure of the gas flow. The results were obtained from m02-hw0 (panels a and b), m02-hw01 (panels c and d), and m05-hw0 (panels e and f). Left column: same as the left column of Fig. 8, but the color contour represents υx,g averaged in the y-direction within the calculation domain of hydrodynamical simulation. Right column: the x-component of the gas flow velocity averaged in the x- and y-directions within the calculation domain of hydrodynamical simulation, ![]() (yellow) and
(yellow) and ![]() (blue). The dashed lines were obtained from hydrodynamical simulations. The solid lines are the fitting formula (Eq. (32)).
(blue). The dashed lines were obtained from hydrodynamical simulations. The solid lines are the fitting formula (Eq. (32)).
Current usage metrics show cumulative count of Article Views (full-text article views including HTML views, PDF and ePub downloads, according to the available data) and Abstracts Views on Vision4Press platform.
Data correspond to usage on the plateform after 2015. The current usage metrics is available 48-96 hours after online publication and is updated daily on week days.
Initial download of the metrics may take a while.