Fig. 13
Download original image
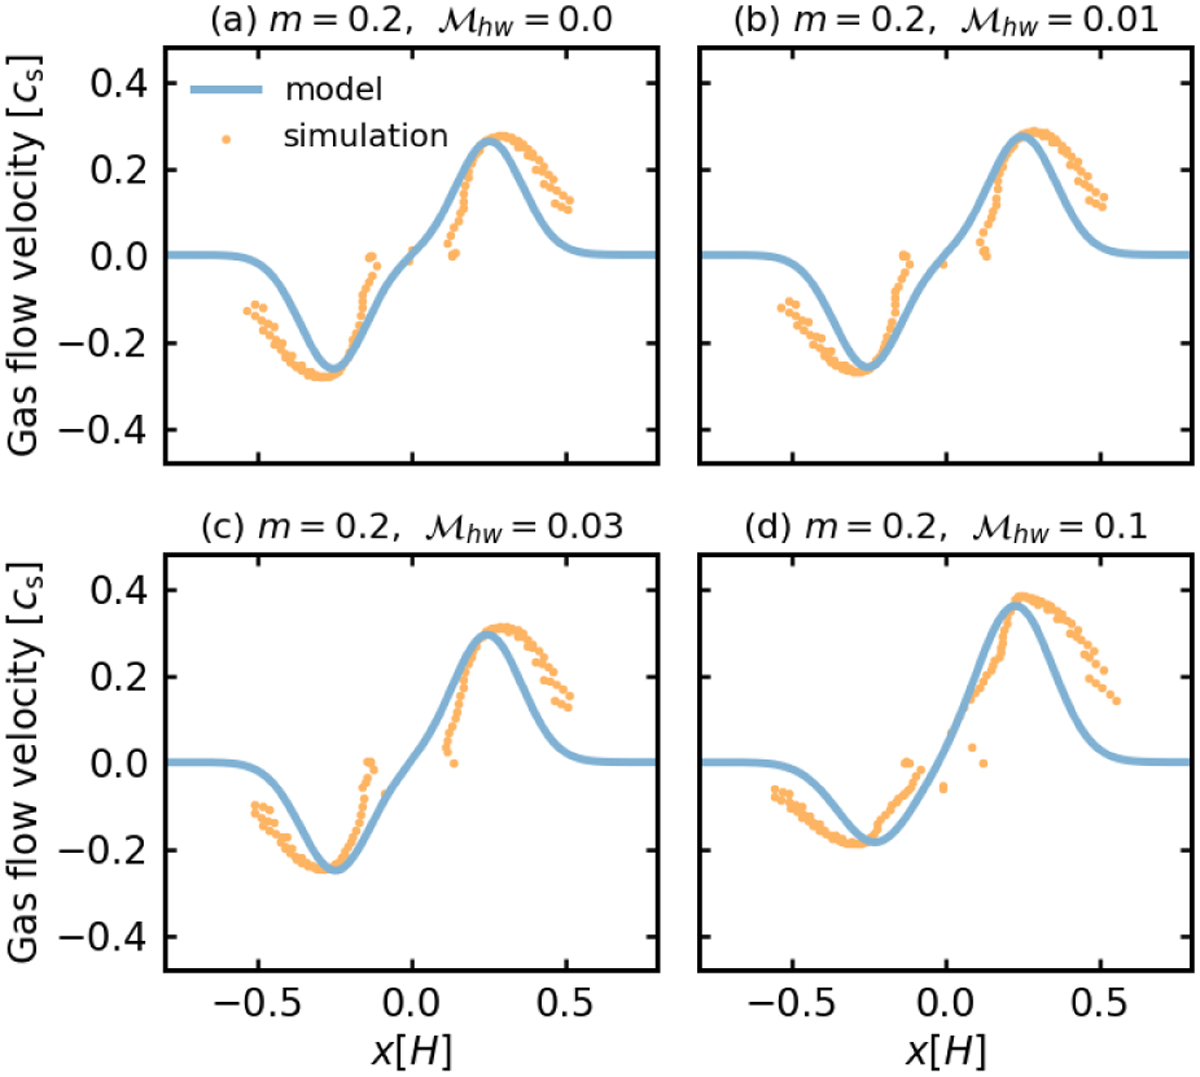
Distribution of the x-component of the gas velocity in the x-direction at the midplane, υx,max(x). The solid blue line is given by Eq. (31). The yellow dots were obtained from m02-hw0 (panel a), m02-hw001 (panel b), m02-hw003 (panel c), and m02-hw01 (panel d). We sampled the gas velocity at each radial grid of hydro-dynamical simulations where the absolute value of the gas velocity was the maximum within the limited region, ![]() , and
, and ![]() .
.
Current usage metrics show cumulative count of Article Views (full-text article views including HTML views, PDF and ePub downloads, according to the available data) and Abstracts Views on Vision4Press platform.
Data correspond to usage on the plateform after 2015. The current usage metrics is available 48-96 hours after online publication and is updated daily on week days.
Initial download of the metrics may take a while.