Fig. 10
Download original image
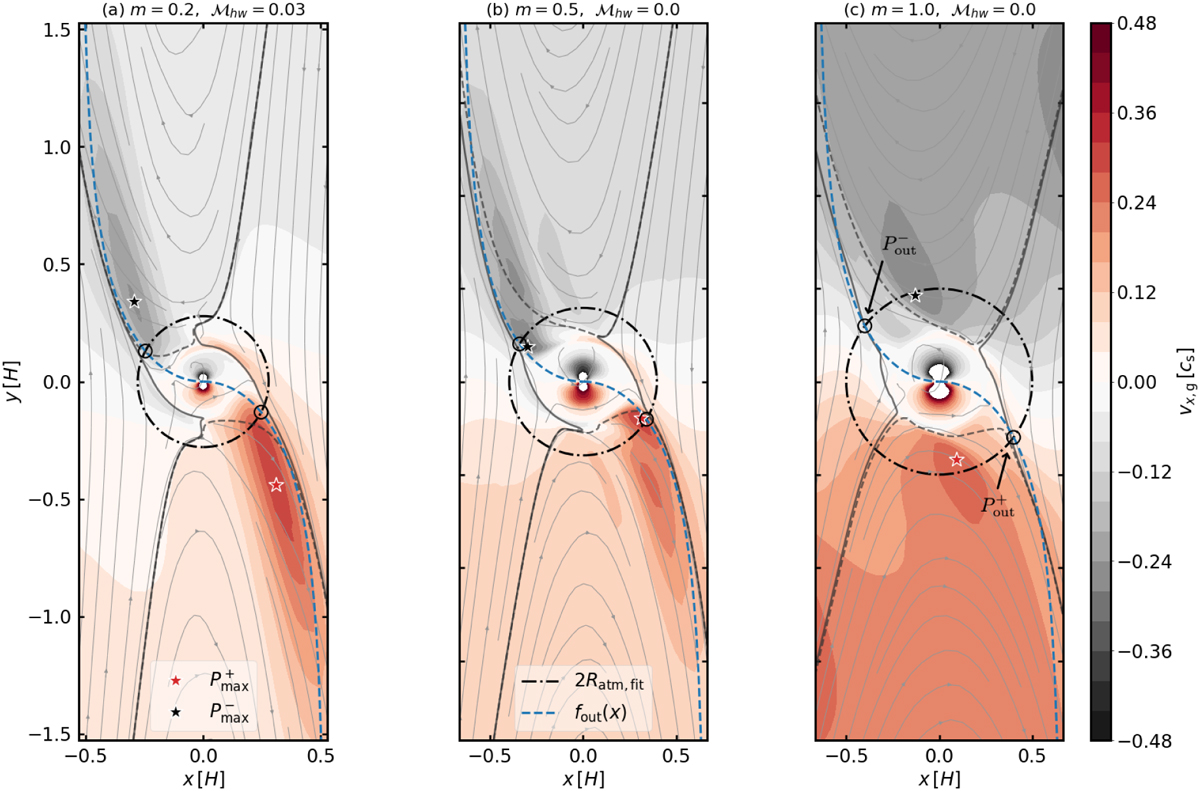
Comparison of the point where υx,g has the maximum value at the midplane and the assumed outflow point, ![]() (the open circle on the dashed-dotted circle). The results were obtained from m02 − hw003 (panel a), m05 − hw0 (panel b), and m1 − hw0 (panel c). The star symbols denote the points where the flow speed in the positive (the red star) and the negative (the black star) x-direction has the maximum value in the limited region,
(the open circle on the dashed-dotted circle). The results were obtained from m02 − hw003 (panel a), m05 − hw0 (panel b), and m1 − hw0 (panel c). The star symbols denote the points where the flow speed in the positive (the red star) and the negative (the black star) x-direction has the maximum value in the limited region, ![]() (the ranges of the x- and y-axes of these panels), and
(the ranges of the x- and y-axes of these panels), and ![]() . The flow speed at the star symbol was plotted in Fig. 9a with the same color star symbol.
. The flow speed at the star symbol was plotted in Fig. 9a with the same color star symbol.
Current usage metrics show cumulative count of Article Views (full-text article views including HTML views, PDF and ePub downloads, according to the available data) and Abstracts Views on Vision4Press platform.
Data correspond to usage on the plateform after 2015. The current usage metrics is available 48-96 hours after online publication and is updated daily on week days.
Initial download of the metrics may take a while.