Open Access
Fig. B.3
Download original image
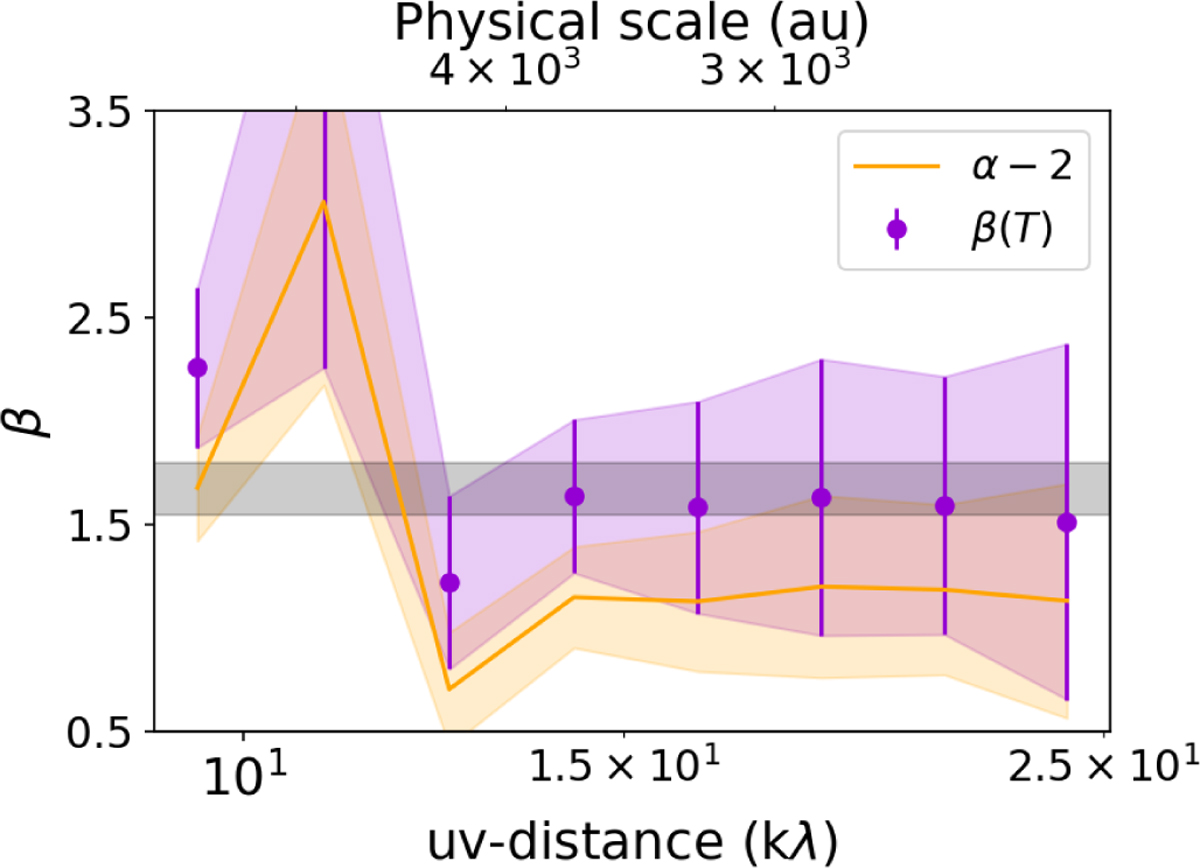
Spectral (orange) and dust opacity (violet) indices as measured across the probed uv distances after subtraction of a point-like source. The mean values α ~ 3.1 and β ~ 1.6 are consistent with what was found across the scale of the streamer in the image-plane analysis.
Current usage metrics show cumulative count of Article Views (full-text article views including HTML views, PDF and ePub downloads, according to the available data) and Abstracts Views on Vision4Press platform.
Data correspond to usage on the plateform after 2015. The current usage metrics is available 48-96 hours after online publication and is updated daily on week days.
Initial download of the metrics may take a while.