Open Access
Fig. B.1
Download original image
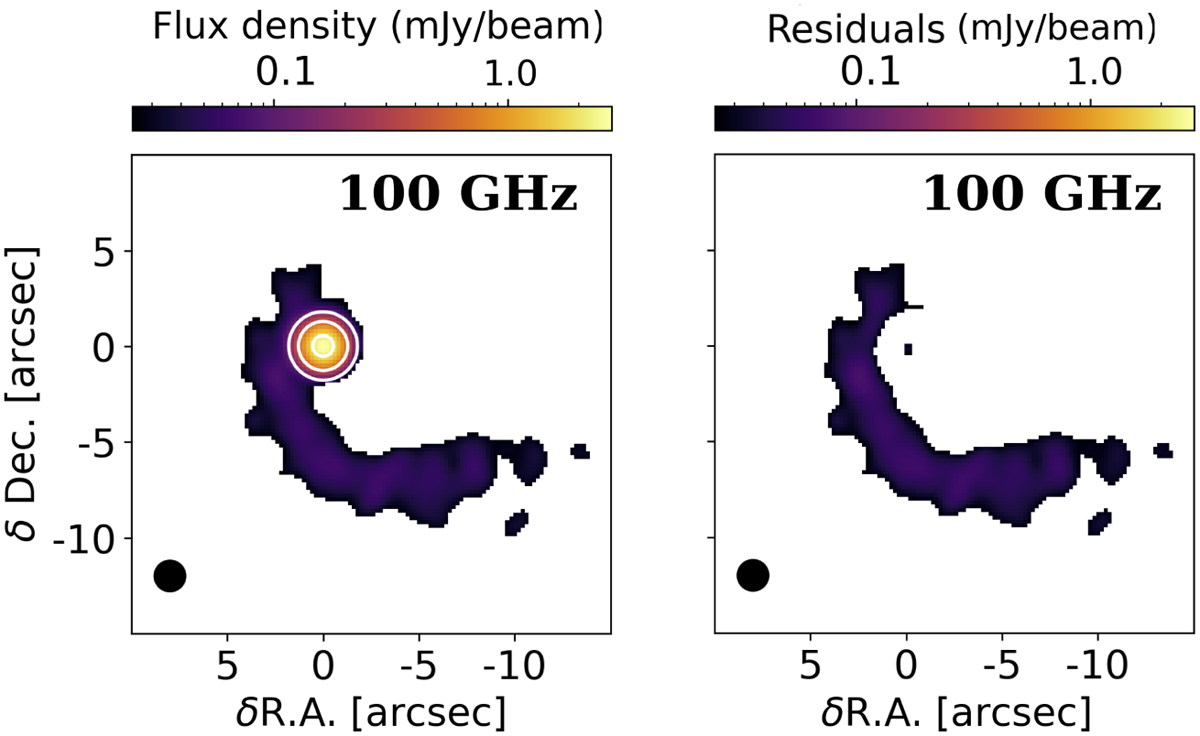
Contour levels (white) of the Gaussian model on top of the ALMA B3 (100 GHz) data of M512 (left). The color bar reports the flux values of the original image. The residuals of the model are shown on the right, and their color bar lies in the same range of values as the original emission to facilitate the comparison.
Current usage metrics show cumulative count of Article Views (full-text article views including HTML views, PDF and ePub downloads, according to the available data) and Abstracts Views on Vision4Press platform.
Data correspond to usage on the plateform after 2015. The current usage metrics is available 48-96 hours after online publication and is updated daily on week days.
Initial download of the metrics may take a while.