Fig. 9
Download original image
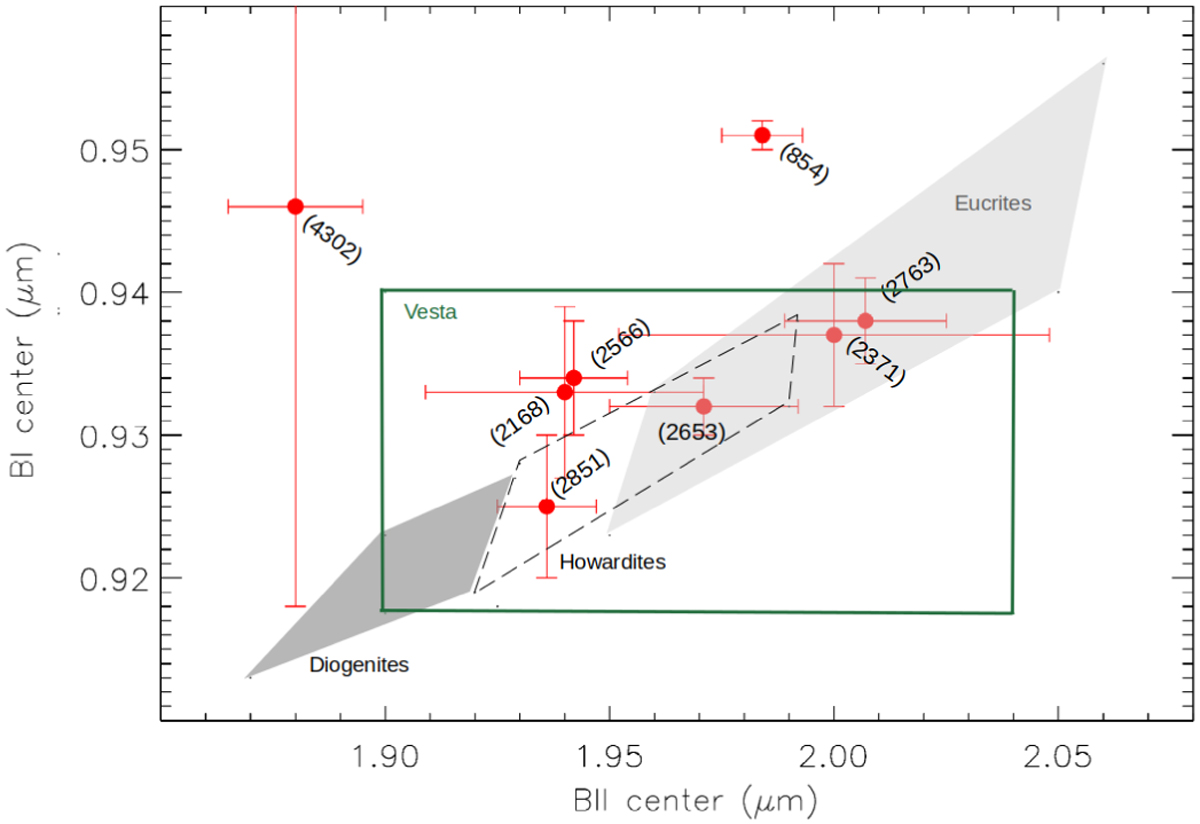
Distribution of potential V-type members of the PSTF in a BI center versus BII center plan. From left to right, the gray areas correspond to the regions of diogenite, howardite, and eucrite mineralogies. The green square corresponds to the space where Vesta is located when considering its variability during multiple observations, according to De Sanctis et al. (2012) and McCoy et al. (2015).
Current usage metrics show cumulative count of Article Views (full-text article views including HTML views, PDF and ePub downloads, according to the available data) and Abstracts Views on Vision4Press platform.
Data correspond to usage on the plateform after 2015. The current usage metrics is available 48-96 hours after online publication and is updated daily on week days.
Initial download of the metrics may take a while.