Fig. 4
Download original image
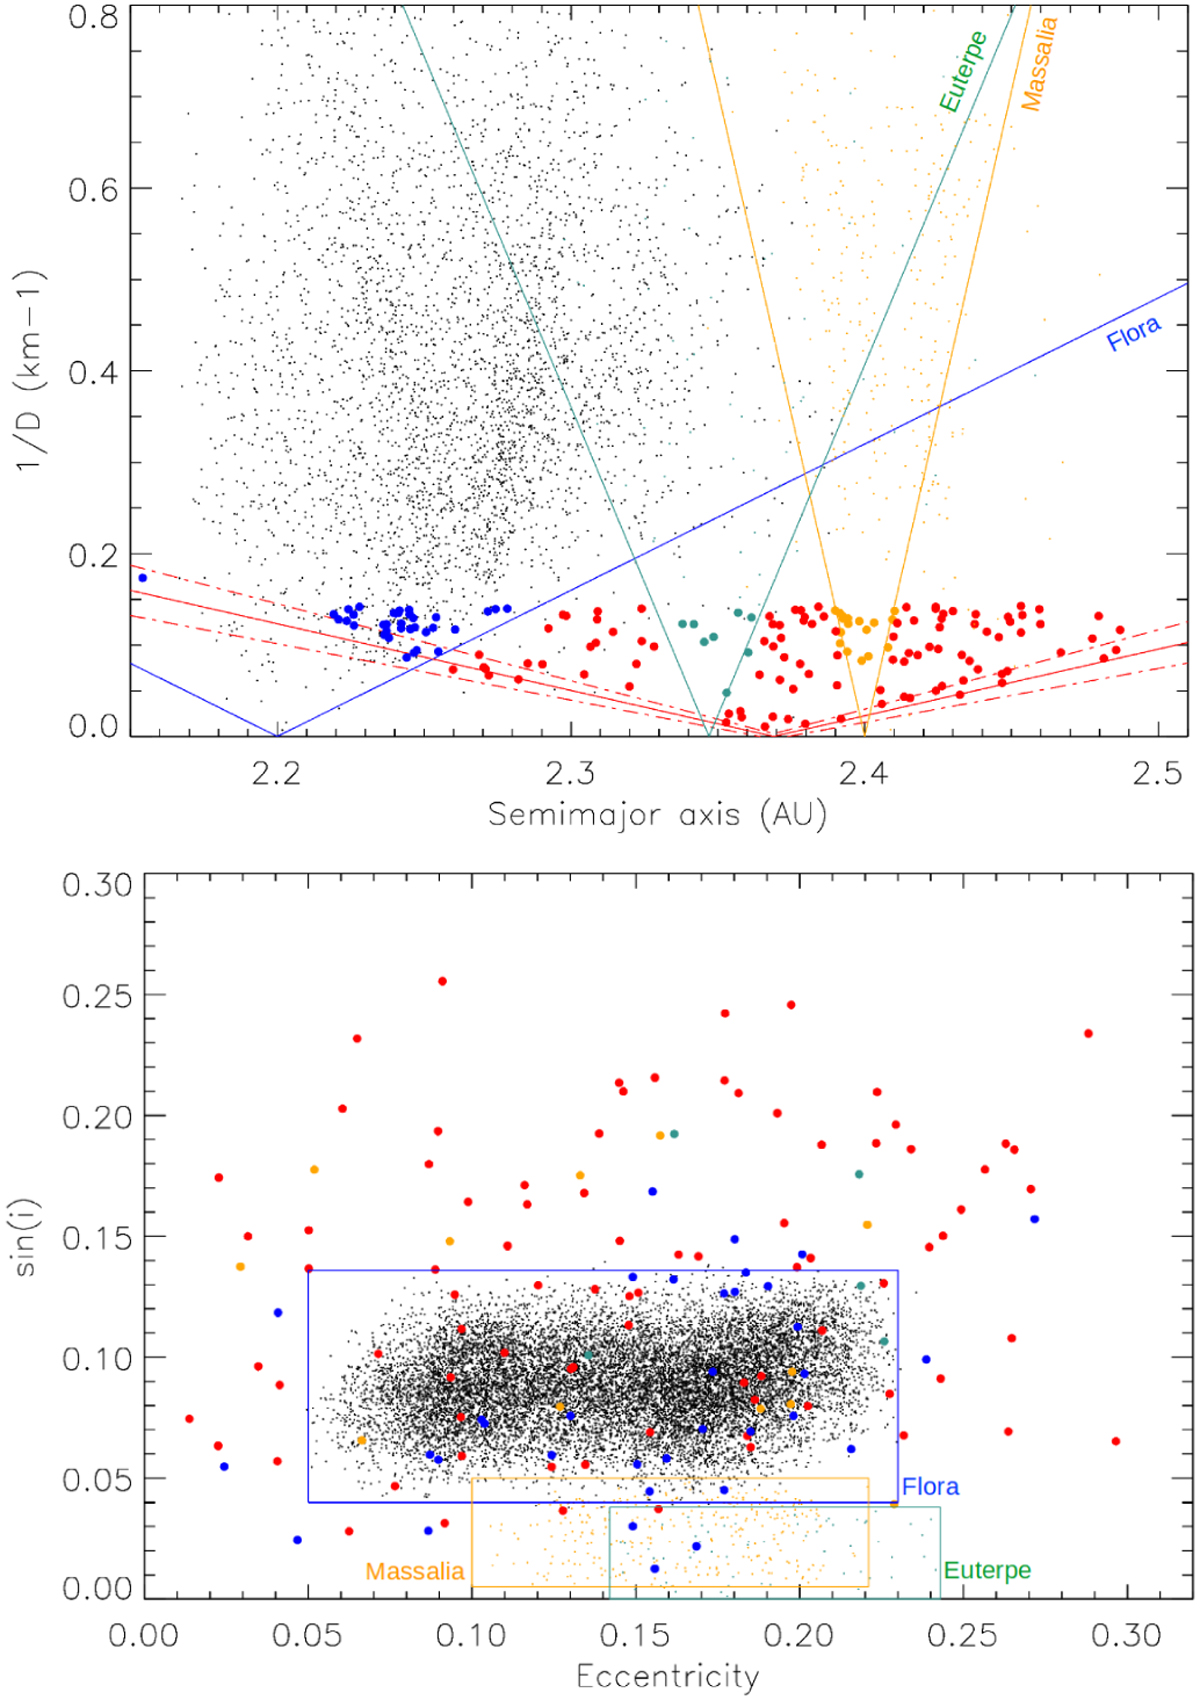
Comparison between the distribution of S-complex PSTF potential members and S-complex background families. Top: V shape of Flora family (in blue) in a plan ![]() versus a. Flora’s members are shown in black. The red points represents the PSTF potential members that are outside all V shapes. The blue, dark green, and orange points represent asteroids that are inside Flora, Euterpe, and the Massalia V shape, respectively. Bottom: distribution of PSTF potential members compared to the typical distribution of members of Flora, Euterpe, and Massalia families. The blue, green, and orange rectangles represent the border of Flora’s, Euterpe’s, and Massalia’s regions, respectively.
versus a. Flora’s members are shown in black. The red points represents the PSTF potential members that are outside all V shapes. The blue, dark green, and orange points represent asteroids that are inside Flora, Euterpe, and the Massalia V shape, respectively. Bottom: distribution of PSTF potential members compared to the typical distribution of members of Flora, Euterpe, and Massalia families. The blue, green, and orange rectangles represent the border of Flora’s, Euterpe’s, and Massalia’s regions, respectively.
Current usage metrics show cumulative count of Article Views (full-text article views including HTML views, PDF and ePub downloads, according to the available data) and Abstracts Views on Vision4Press platform.
Data correspond to usage on the plateform after 2015. The current usage metrics is available 48-96 hours after online publication and is updated daily on week days.
Initial download of the metrics may take a while.