Fig. 3
Download original image
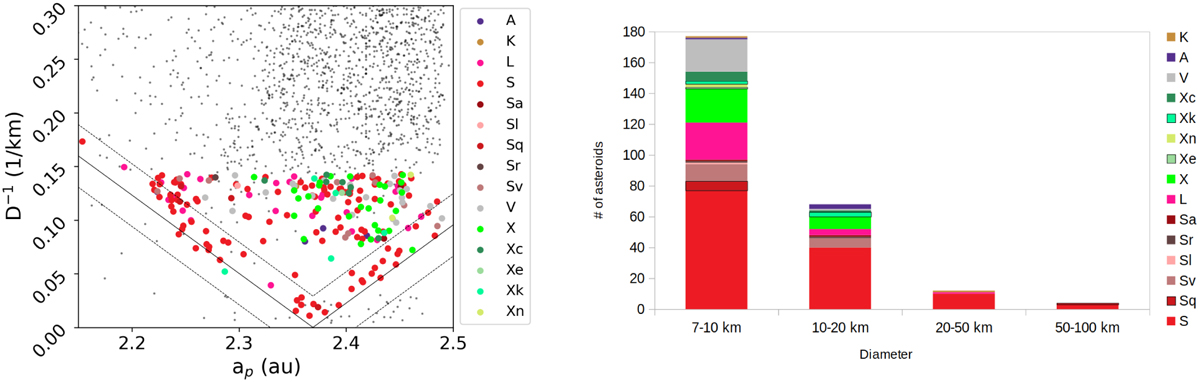
Different distributions of taxonomic classes determined in this study. Left: PSTF’s V shape with taxonomical distribution of its potential members. The V shape presented in this plot (the black line and the dashed lines) is from Ferrone et al. (2023). We refer the reader to that paper for further details regarding the V-shape determination. Right: distribution of the spectral classes of the potential PSTF members per size bin.
Current usage metrics show cumulative count of Article Views (full-text article views including HTML views, PDF and ePub downloads, according to the available data) and Abstracts Views on Vision4Press platform.
Data correspond to usage on the plateform after 2015. The current usage metrics is available 48-96 hours after online publication and is updated daily on week days.
Initial download of the metrics may take a while.