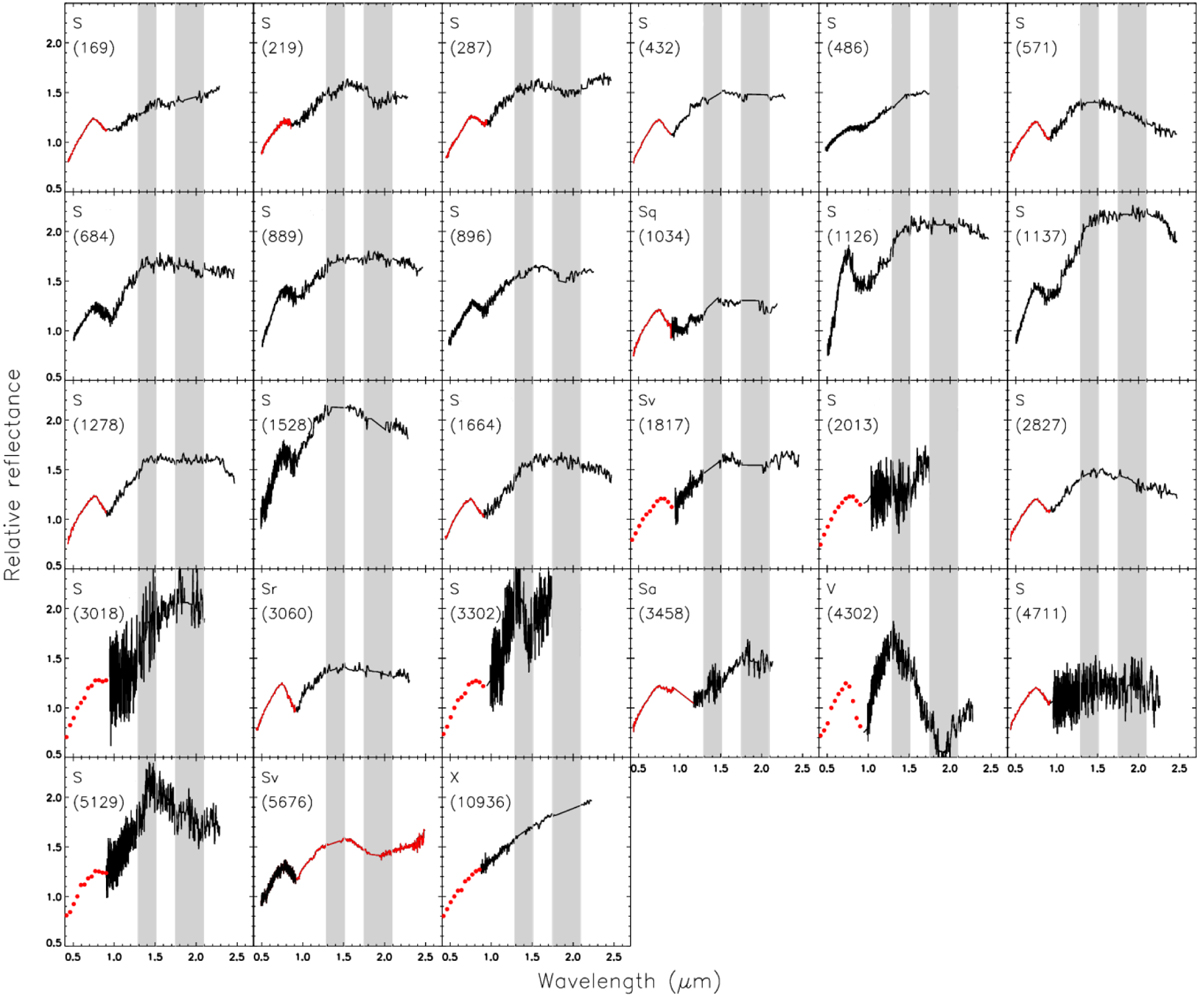
Fig. 1
Download original image
Observed spectra of potential members of the PSTF family. The new observations are presented in black, while spectra from the literature are shown in red. The red points, in the visible range, represent the Gaia data (uncertainties are often within the symbol size). Gray areas correspond to the position of the main telluric absorption bands. The taxonomy presented in this plot is the one we estimated (see Sect. 3.4).
Current usage metrics show cumulative count of Article Views (full-text article views including HTML views, PDF and ePub downloads, according to the available data) and Abstracts Views on Vision4Press platform.
Data correspond to usage on the plateform after 2015. The current usage metrics is available 48-96 hours after online publication and is updated daily on week days.
Initial download of the metrics may take a while.