Fig. 9
Download original image
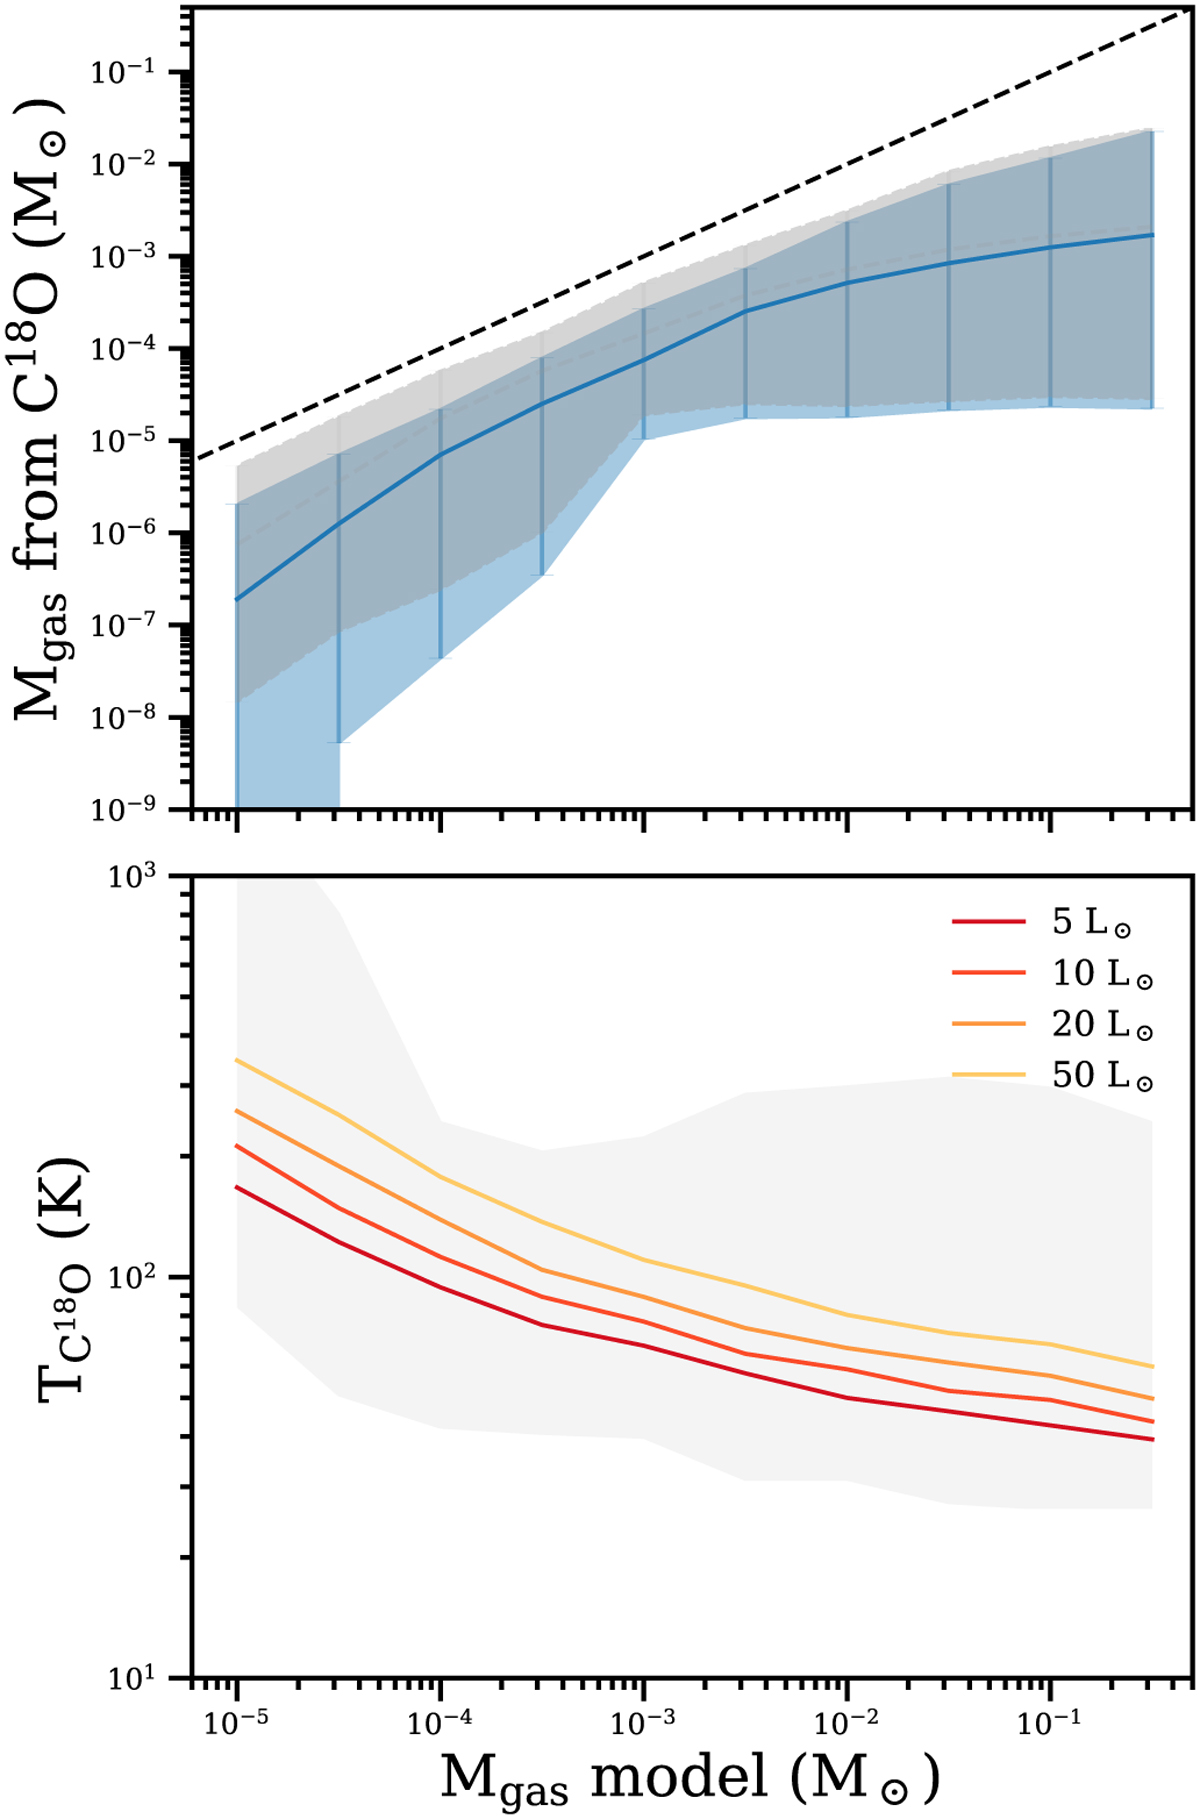
Gas mass of the models versus the retrieved gas mass from the C18O flux using Eq. (4), and the mass-weighted average of the temperature in the C18O emitting region. For the blue shaded region a temperature of 40 K is used, the gray shaded region uses the temperature of each model shown in the bottom panel. The shaded areas are the minimum and maximum values, with the mean value indicated by the solid line. The dashed line indicates the one-to-one correspondence between the two masses. The typical range in temperatures is indicated by the gray shaded region in the bottom panel.
Current usage metrics show cumulative count of Article Views (full-text article views including HTML views, PDF and ePub downloads, according to the available data) and Abstracts Views on Vision4Press platform.
Data correspond to usage on the plateform after 2015. The current usage metrics is available 48-96 hours after online publication and is updated daily on week days.
Initial download of the metrics may take a while.