Fig. 7
Download original image
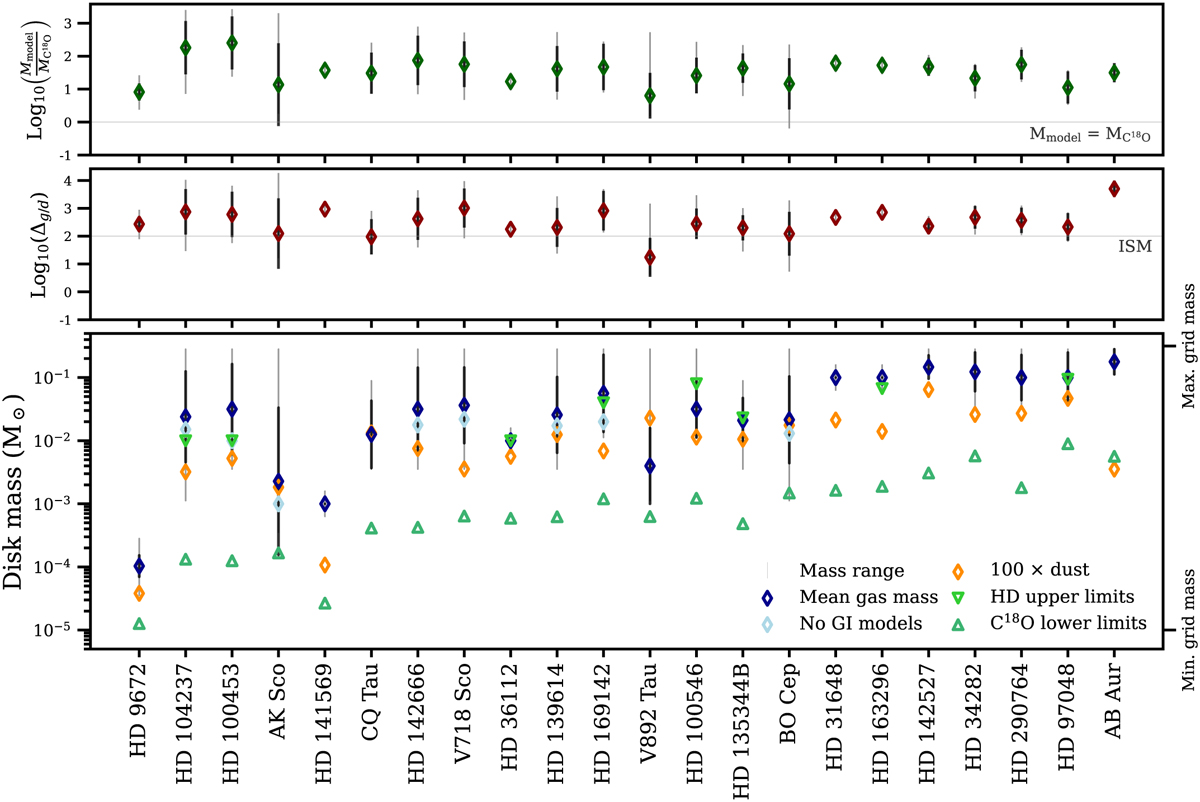
Gas masses of the Herbig disks detected in the CO isotopologues as selected from the models presented in Fig. 5. The disks are ordered from left to right by increasing 13CO luminosity. The gray lines indicate the range in possible disk mass based on the disk parameters listed in Table 1, while the black lines indicate the standard deviation. The mean mass of these models is given as the dark blue diamond. After removing models which are potentially gravitationally unstable, the mean mass changes into the light blue diamond. The orange diamonds are taken from the dust masses of Stapper et al. (2022) multiplied by the canonical gas-to-dust ratio of 100. The HD upper limits from Kama et al. (2020) are shown as green downward pointing triangles. The C18O lower limits are directly obtained from the integrated flux. The middle panel shows the resulting gas-to-dust ratio based on the mass range and mean values, and the top panel shows the factor by which the mass could be underestimated when using C18O assuming optically thin emission.
Current usage metrics show cumulative count of Article Views (full-text article views including HTML views, PDF and ePub downloads, according to the available data) and Abstracts Views on Vision4Press platform.
Data correspond to usage on the plateform after 2015. The current usage metrics is available 48-96 hours after online publication and is updated daily on week days.
Initial download of the metrics may take a while.