Fig. 5
Download original image
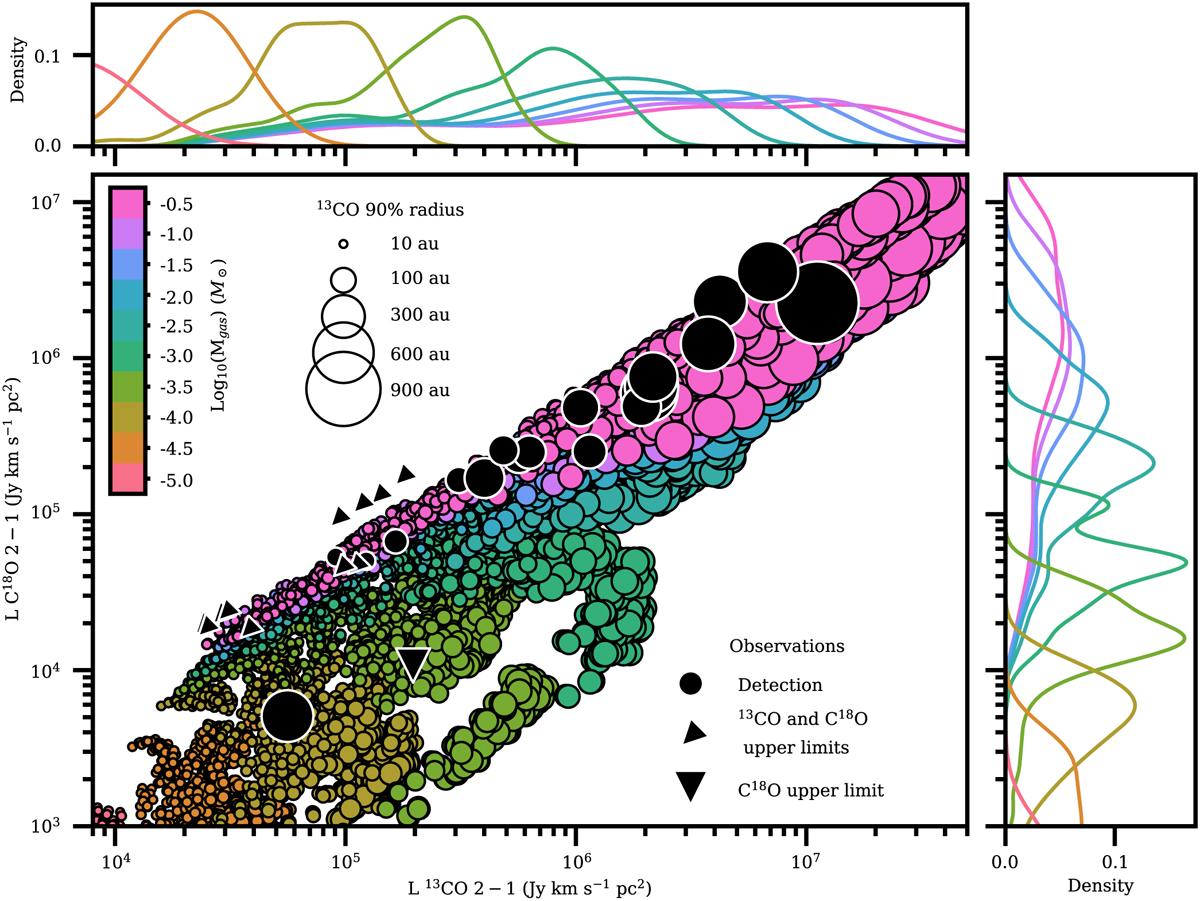
C18O luminosity versus 13CO luminosity for the DALI models (colored circles) and the observations (black circles). The colors indicate the gas mass of the disk model. The size of the markers indicate the 90% radius of the 13CO emission. Probability density curves of the models for each gas mass are shown along the x-axis in the top panel and along the y-axis in the right panel, i.e., most models of a particular gas mass reside around the peak of each curve.
Current usage metrics show cumulative count of Article Views (full-text article views including HTML views, PDF and ePub downloads, according to the available data) and Abstracts Views on Vision4Press platform.
Data correspond to usage on the plateform after 2015. The current usage metrics is available 48-96 hours after online publication and is updated daily on week days.
Initial download of the metrics may take a while.