Fig. 4
Download original image
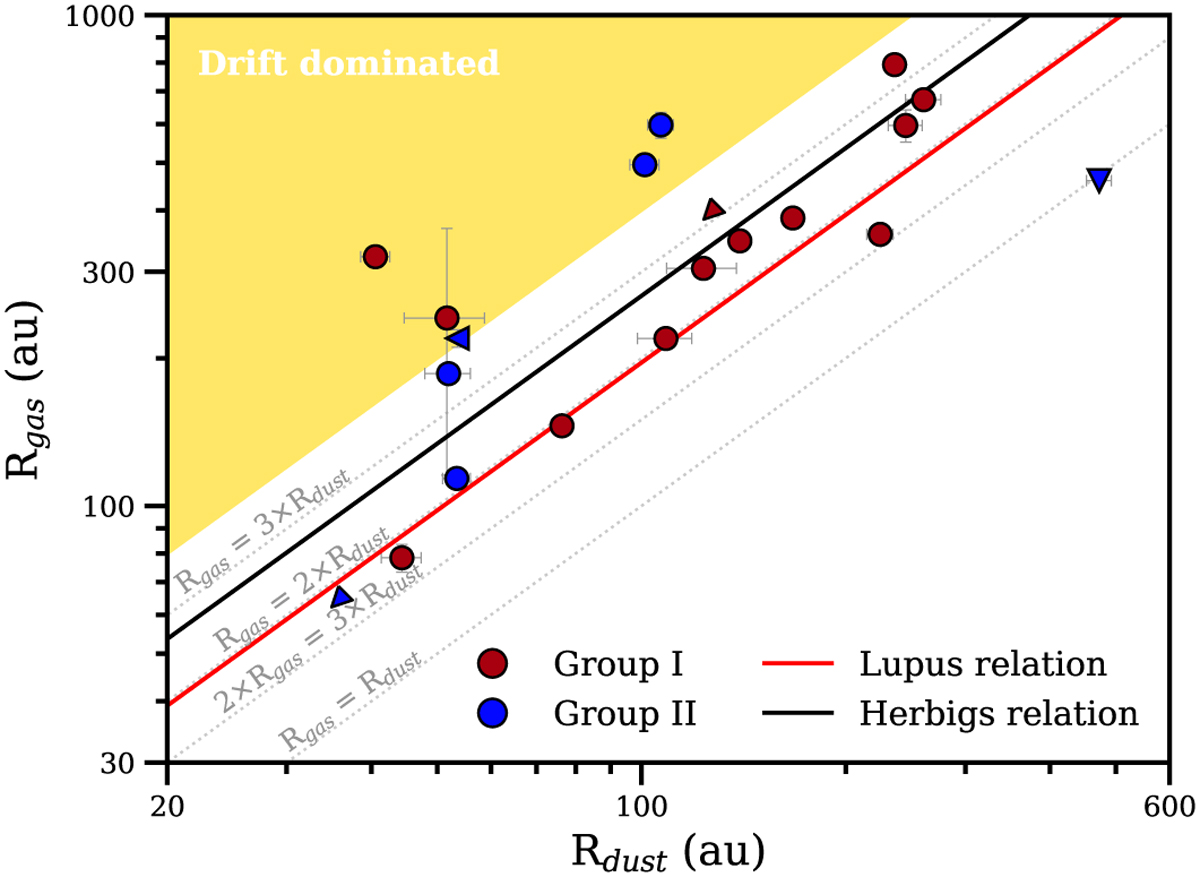
Gas radii versus dust radii of the Herbig disks with detected 12CO emission, both R90%. An upper limit on the gas radius or dust radius, or both, is marked with a triangle pointing in the corresponding direction(s). The colors indicate the Meeus et al. (2001) group of the disk: red is group I, blue group II. Lines for different Rdust to Rgas ratios are shown as well. The black line shows for the resolved disks the relation of the R90% radii. Using R68% does not alter the relation significantly. The yellow region indicates the region where the difference between the dust and gas radii cannot solely be explained by optical depth effects, and radial drift is necessary (Trapman et al. 2019). The red line corresponds to the relation found for the disks in Lupus (Ansdell et al. 2018).
Current usage metrics show cumulative count of Article Views (full-text article views including HTML views, PDF and ePub downloads, according to the available data) and Abstracts Views on Vision4Press platform.
Data correspond to usage on the plateform after 2015. The current usage metrics is available 48-96 hours after online publication and is updated daily on week days.
Initial download of the metrics may take a while.