Fig. 16
Download original image
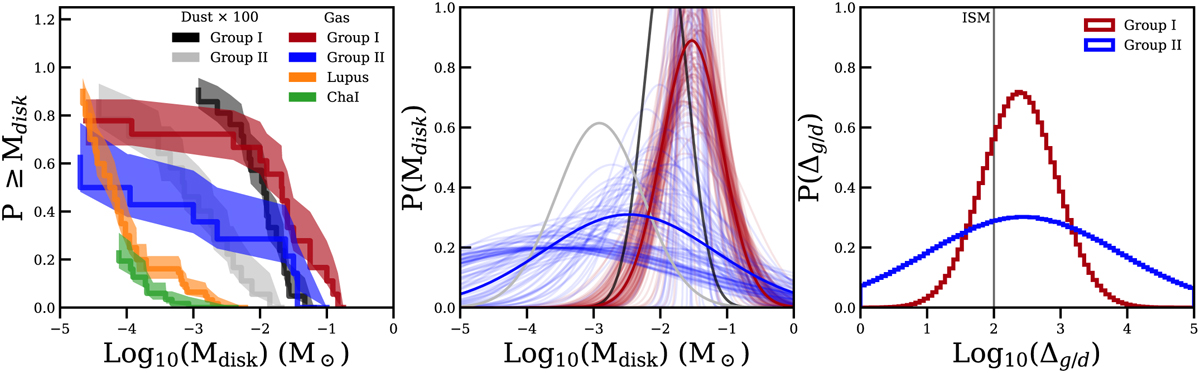
Cumulative distributions of the dust and gas masses of the Herbigs separated into group I and group II. The dust distributions are shown in the left and middle panel in dark gray for group I and light gray for group II. In addition, the gas distributions from Lupus (orange) and Chamaeleon I (green) is shown (Miotello et al. 2017; Long et al. 2017). The fitted probability distributions are shown in the middle panel. The resulting gas-to-dust ratios are presented in the right panel.
Current usage metrics show cumulative count of Article Views (full-text article views including HTML views, PDF and ePub downloads, according to the available data) and Abstracts Views on Vision4Press platform.
Data correspond to usage on the plateform after 2015. The current usage metrics is available 48-96 hours after online publication and is updated daily on week days.
Initial download of the metrics may take a while.