Fig. 15
Download original image
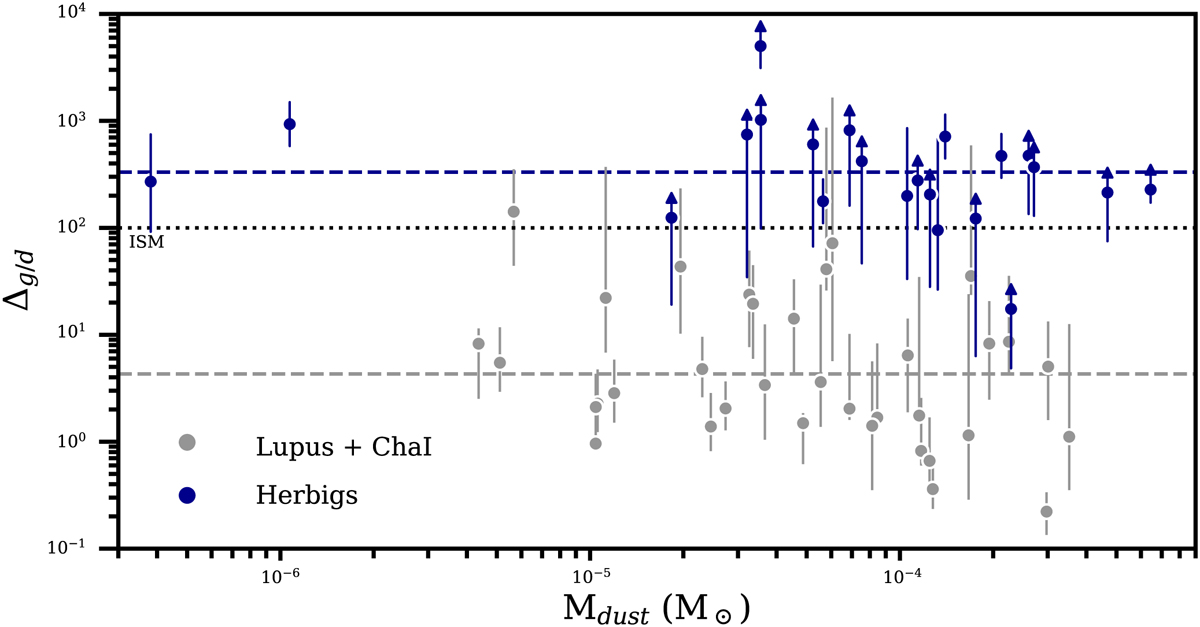
Gas-to-dust ratio of the Herbig disks compared to T Tauri disks in Lupus and Chamaeleon I (Ansdell et al. 2016; Pascucci et al. 2016; Miotello et al. 2017; Long et al. 2017). The corresponding horizontal dashed lines are the logarithmic mean values. The canonical value of 100 is indicated as the horizontal black dotted line.
Current usage metrics show cumulative count of Article Views (full-text article views including HTML views, PDF and ePub downloads, according to the available data) and Abstracts Views on Vision4Press platform.
Data correspond to usage on the plateform after 2015. The current usage metrics is available 48-96 hours after online publication and is updated daily on week days.
Initial download of the metrics may take a while.