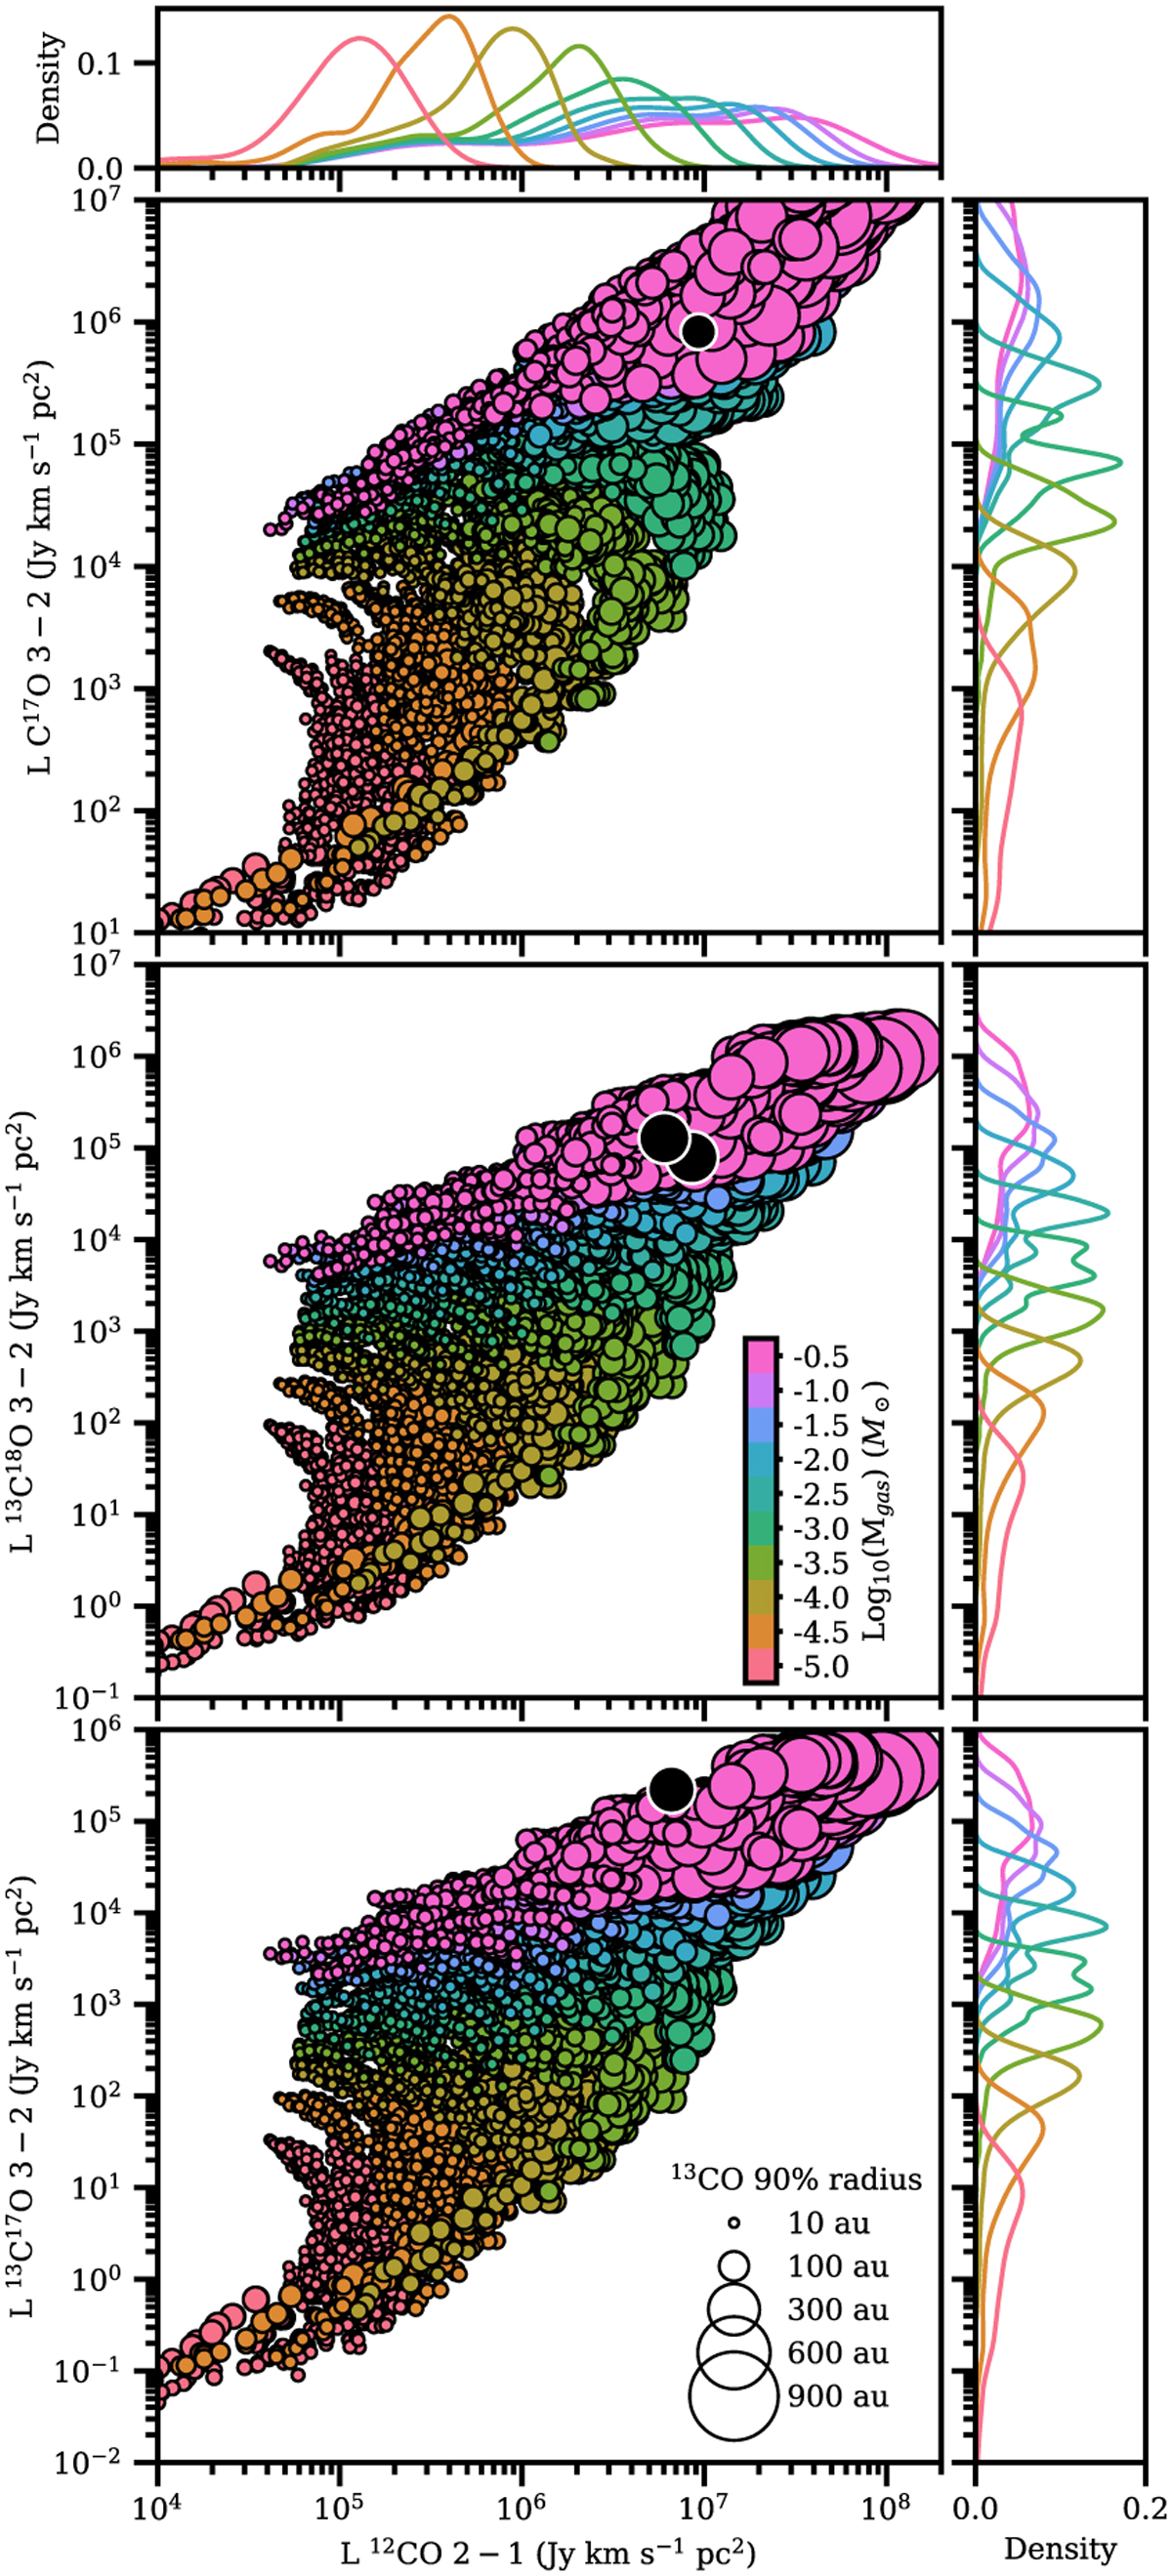
Fig. 12
Download original image
Similar to Fig. 5, but now with C17O, 13C18O and 13C17O on the vertical axes and 12CO on the horizontal axis. The black dots mark HD 100546 observations of C17O J = 3–2 (Booth, A., priv. comm.), HD 163296 observations of 13C17O J = 3–2 from Booth et al. (2019), HD 31648 observations of 13C18O J = 3–2 from Loomis et al. (2020), and HD 142527 observations of 13C18O J = 3–2 by Temmink et al. (2023). Similar to Fig. 5 probability density curves are shown along the vertical and horizontal axes to indicate where most of the models of a particular mass reside.
Current usage metrics show cumulative count of Article Views (full-text article views including HTML views, PDF and ePub downloads, according to the available data) and Abstracts Views on Vision4Press platform.
Data correspond to usage on the plateform after 2015. The current usage metrics is available 48-96 hours after online publication and is updated daily on week days.
Initial download of the metrics may take a while.