Fig. 11
Download original image
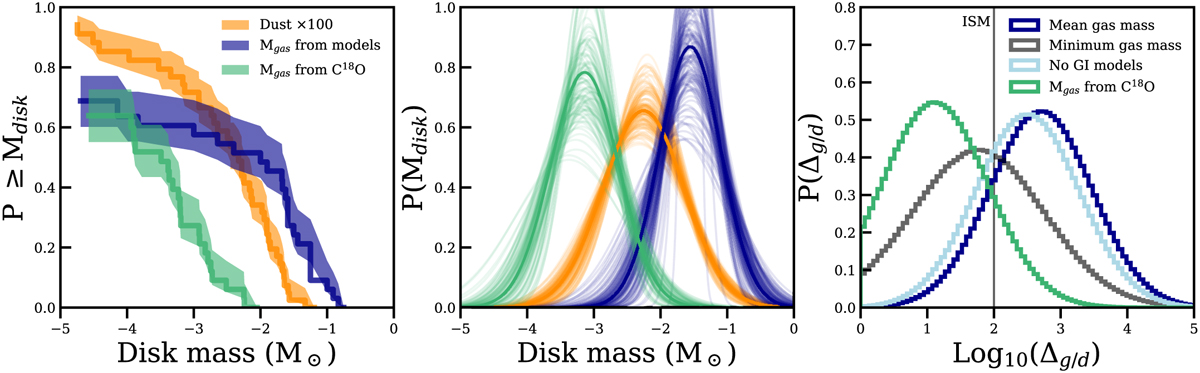
Cumulative distributions of the gas masses from Figs. 7 and 10 obtained from our models (dark blue) and obtained from the C18O flux (green), and dust masses ×100 (orange) from Stapper et al. (2022). The corresponding probability distributions are shown in the middle panel, obtained by fitting a lognormal distribution to the cumulative distributions. The faint lines indicate the possible range in fits. Sampling from the gas and dust distributions a distribution of possible gas-to-dust mass ratios can be made, as shown in the right most panel.
Current usage metrics show cumulative count of Article Views (full-text article views including HTML views, PDF and ePub downloads, according to the available data) and Abstracts Views on Vision4Press platform.
Data correspond to usage on the plateform after 2015. The current usage metrics is available 48-96 hours after online publication and is updated daily on week days.
Initial download of the metrics may take a while.