Open Access
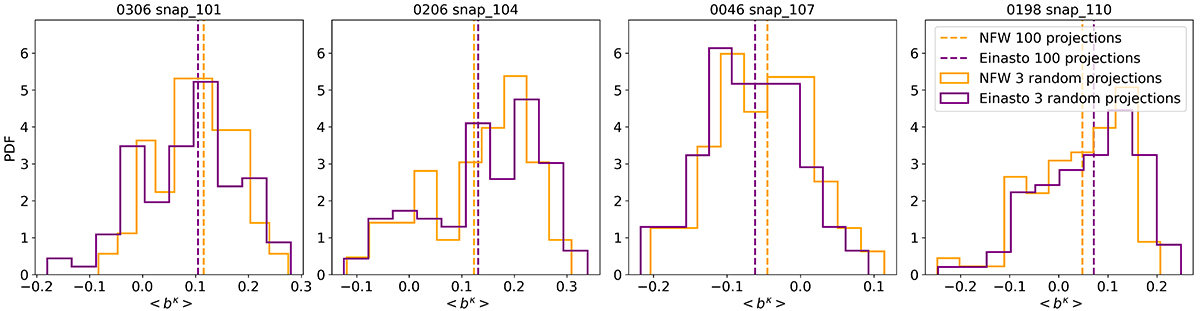
Fig. 9.
Download original image
Mean bias per cluster. The vertical lines show the mean bias when using 100 projections to reconstruct the mass. The histograms are obtained from the mean bias computed by taking randomly 3 projections out of the 100 available 100 times.
Current usage metrics show cumulative count of Article Views (full-text article views including HTML views, PDF and ePub downloads, according to the available data) and Abstracts Views on Vision4Press platform.
Data correspond to usage on the plateform after 2015. The current usage metrics is available 48-96 hours after online publication and is updated daily on week days.
Initial download of the metrics may take a while.