Fig. 8.
Download original image
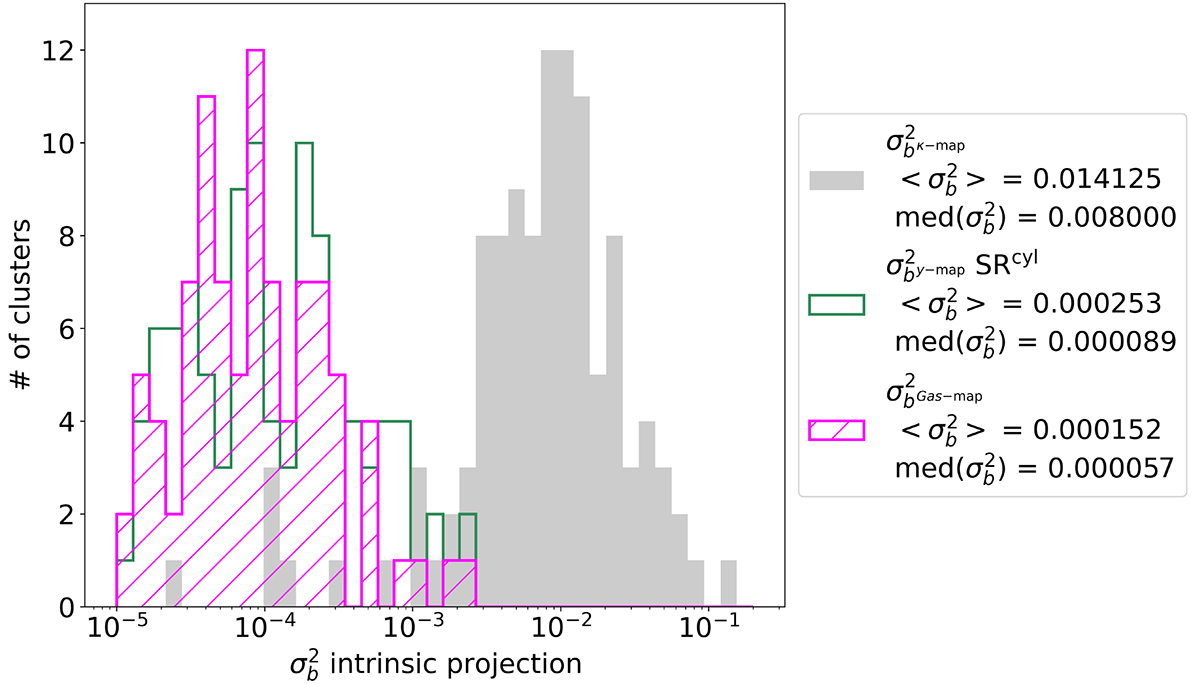
Variance of the mass bias estimated from maps. The grey histogram is obtained from the integration of convergence maps, i.e. ![]() . The magenta histogram corresponds to the variance for gas masses (
. The magenta histogram corresponds to the variance for gas masses (![]() ) estimated from gas mass maps. The empty green histogram shows the dispersion of the
) estimated from gas mass maps. The empty green histogram shows the dispersion of the ![]() after conversion from the
after conversion from the ![]() measured from y-maps, using the scaling relation in Fig. E.1.
measured from y-maps, using the scaling relation in Fig. E.1.
Current usage metrics show cumulative count of Article Views (full-text article views including HTML views, PDF and ePub downloads, according to the available data) and Abstracts Views on Vision4Press platform.
Data correspond to usage on the plateform after 2015. The current usage metrics is available 48-96 hours after online publication and is updated daily on week days.
Initial download of the metrics may take a while.