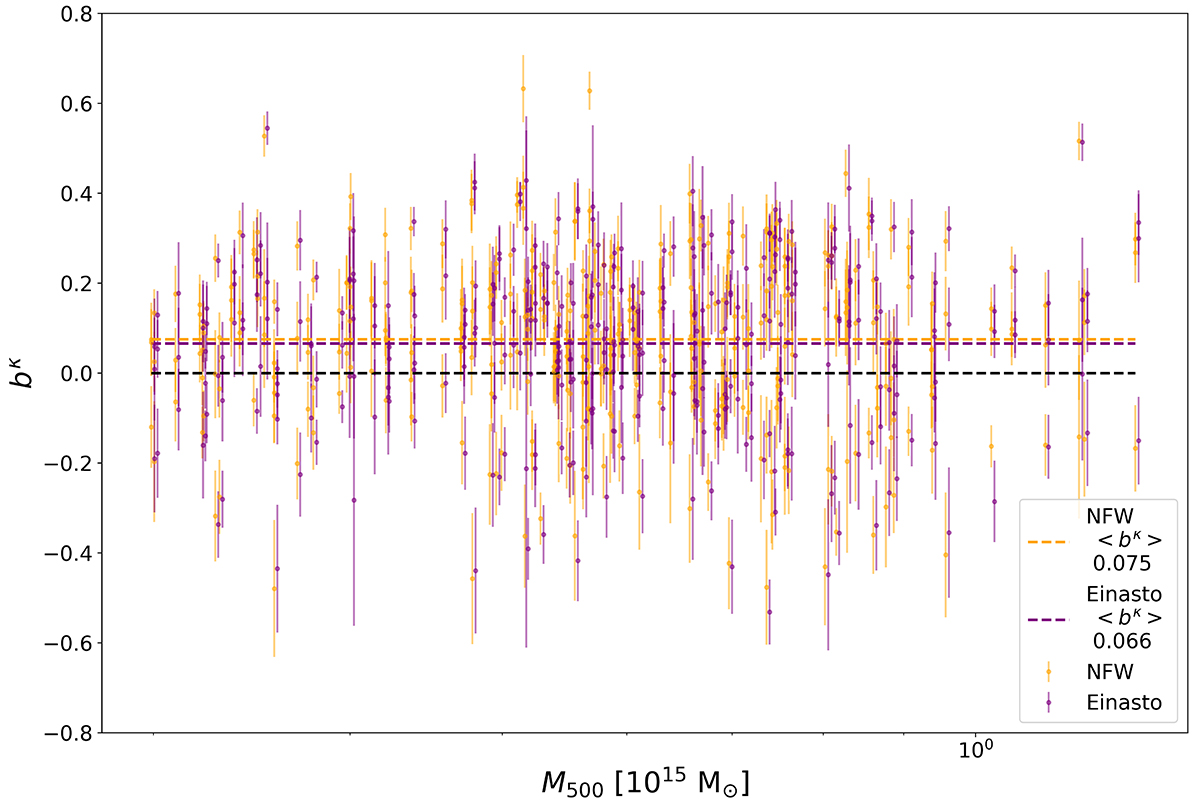
Fig. 4.
Download original image
Mass bias for masses inferred from fitted κ-maps with respect to M500 per cluster. Each data point corresponds to the mean bias of a cluster for a given random projection (0, 1 or 2) with error bars showing the 1σ uncertainty. Results for the Einasto model have been artificially shifted in mass for visualisation purposes. The horizontal orange and purple dashed lines show the mean for all the results for NFW and Einasto, respectively. The black line indicates the zero.
Current usage metrics show cumulative count of Article Views (full-text article views including HTML views, PDF and ePub downloads, according to the available data) and Abstracts Views on Vision4Press platform.
Data correspond to usage on the plateform after 2015. The current usage metrics is available 48-96 hours after online publication and is updated daily on week days.
Initial download of the metrics may take a while.