Fig. 2.
Download original image
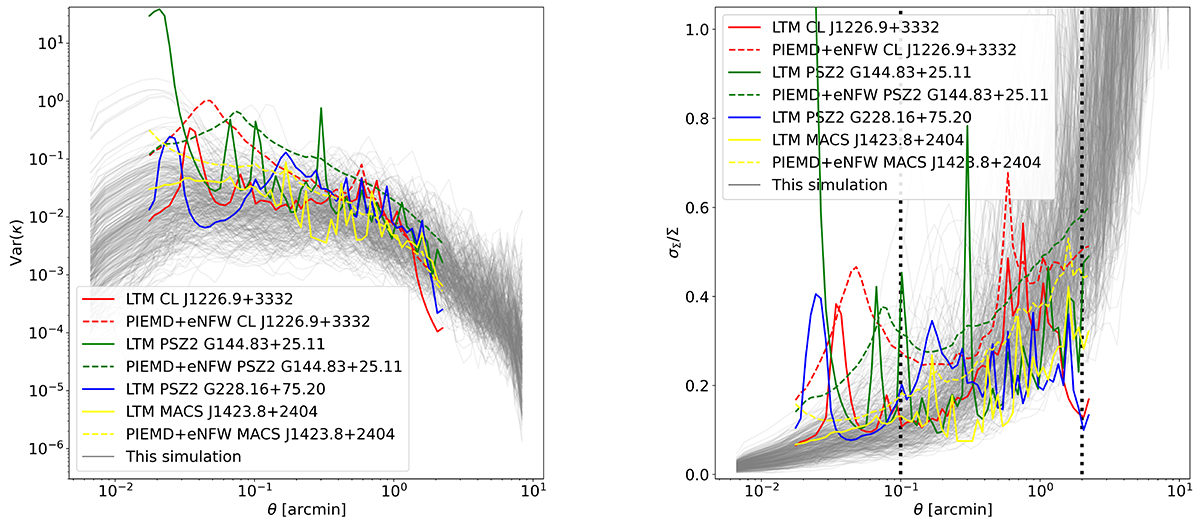
Variance of the convergence profiles (left) and fractional error of the Σ-profiles (right) calculated from convergence maps. In grey we show the profiles for the simulated clusters in THE THREE HUNDRED-NIKA2 LPSZ samples. Red, green, blue, and yellow profiles correspond to CL J1226.9+3332, PSZ2 G144.83+25.11, PSZ2 G228.16+75.20, and MACS J1423.8+2404 clusters, respectively, with data from the CLASH convergence maps (Zitrin et al. 2015) and uncertainties computed following Muñoz-Echeverría et al. (2023; sample defined in Muñoz-Echeverría et al. 2022). Solid and dashed lines differentiate the profiles for the CLASH convergence maps reconstructed assuming the Light-Traces-Mass (LTM) and the Pseudo-Isothermal Elliptical Mass Distribution with an elliptical NFW (PIEMD+eNFW) models, respectively. Vertical dotted lines in the right panel indicate the minimum and maximum of the used radial range.
Current usage metrics show cumulative count of Article Views (full-text article views including HTML views, PDF and ePub downloads, according to the available data) and Abstracts Views on Vision4Press platform.
Data correspond to usage on the plateform after 2015. The current usage metrics is available 48-96 hours after online publication and is updated daily on week days.
Initial download of the metrics may take a while.