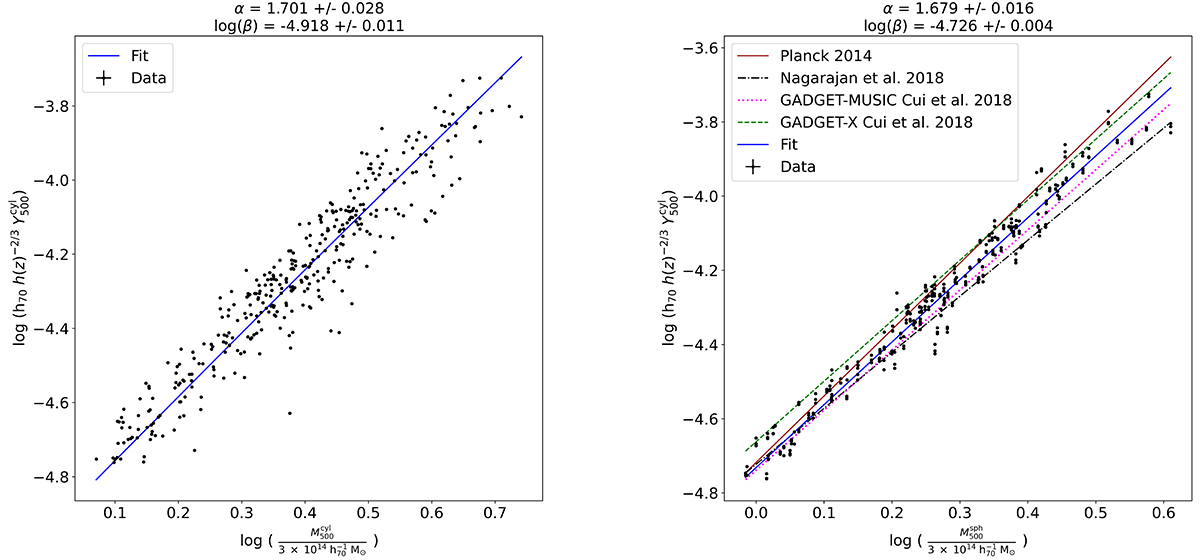
Fig. E.1.
Download original image
Scaling relations between Y500 and M500 for cylindrically integrated SZ signal with respect to spherically (right) and cylindrically (left) integrated masses. Black dots correspond to the values per cluster in our sample, while the blue line shows the best-fit relation. The solid brown line shows the result in Planck Collaboration XX (2014), the black dash-dotted is from Nagarajan et al. (2018). The pink dotted and green dashed relations are the results in Cui et al. (2018) for the GADGET-MUSIC and GADGET-X simulations.
Current usage metrics show cumulative count of Article Views (full-text article views including HTML views, PDF and ePub downloads, according to the available data) and Abstracts Views on Vision4Press platform.
Data correspond to usage on the plateform after 2015. The current usage metrics is available 48-96 hours after online publication and is updated daily on week days.
Initial download of the metrics may take a while.