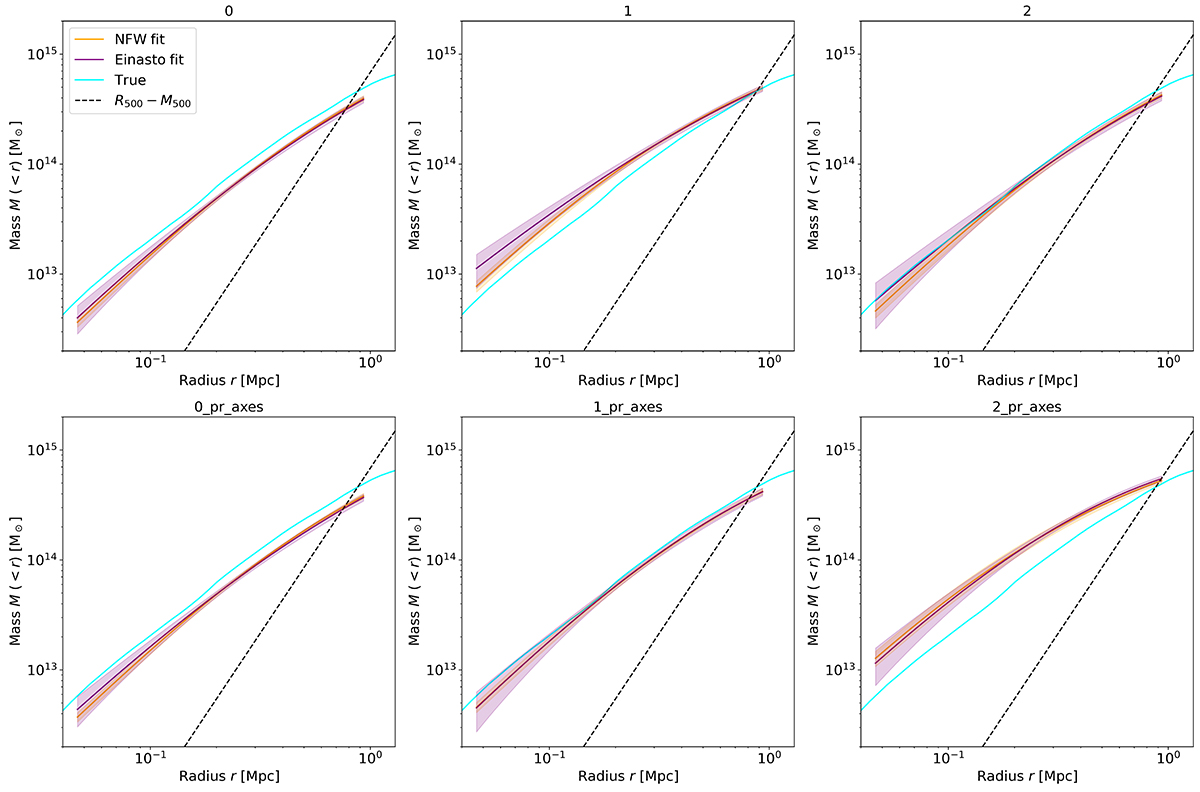
Fig. A.2.
Download original image
Mass profiles reconstructed from the convergence map fits for the 0306 cluster in the snapshot 101 (z = 0.817). The orange and purple profiles correspond to NFW and Einasto models, respectively. We give the mean profiles with 1σ contours. The cyan profile is the spherical mass profile obtained from the simulation. The black dashed line shows the R500 − M500 relation.
Current usage metrics show cumulative count of Article Views (full-text article views including HTML views, PDF and ePub downloads, according to the available data) and Abstracts Views on Vision4Press platform.
Data correspond to usage on the plateform after 2015. The current usage metrics is available 48-96 hours after online publication and is updated daily on week days.
Initial download of the metrics may take a while.